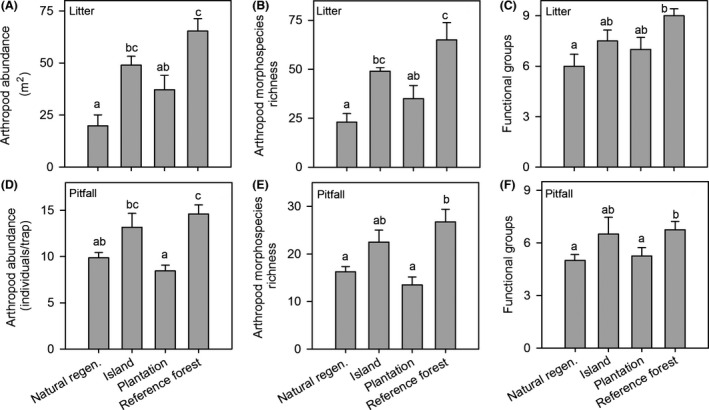
Figure 1.

Litter and pitfall sample arthropod abundance (A, D), morphospecies richness (B, E), and the number of functional groups (C, F) in four habitat types. Error bars indicate +1 SE. Means with the same letter are not significantly different using Tukey's multiple comparison procedure (P < 0.05).
