
Figure 1.
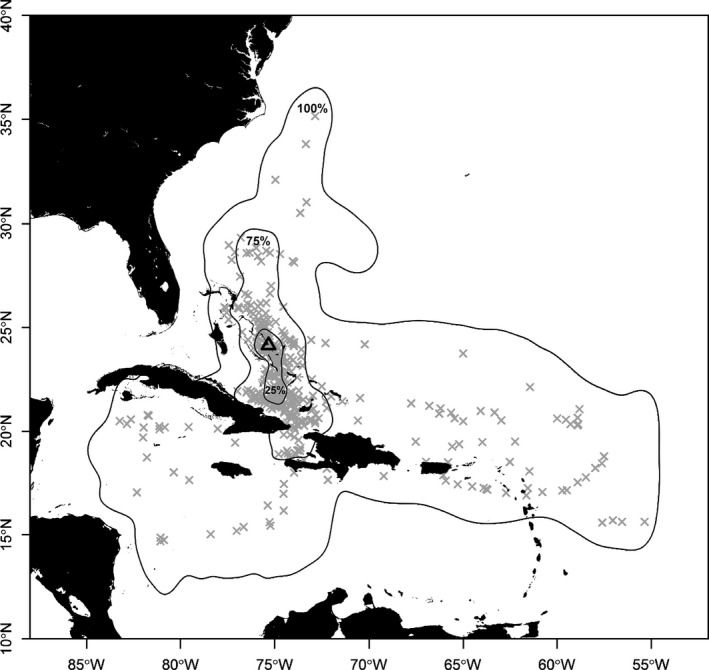
Map displaying 25%, 75%, and 100% utilization distribution contours from 16 recovered X‐Tags. Approximate mesopelagic excursion locations indicated by gray X and deployment location indicated by triangle.
Official websites use .gov
A
.gov website belongs to an official
government organization in the United States.
Secure .gov websites use HTTPS
A lock (
) or https:// means you've safely
connected to the .gov website. Share sensitive
information only on official, secure websites.
Map displaying 25%, 75%, and 100% utilization distribution contours from 16 recovered X‐Tags. Approximate mesopelagic excursion locations indicated by gray X and deployment location indicated by triangle.