Figure 2.

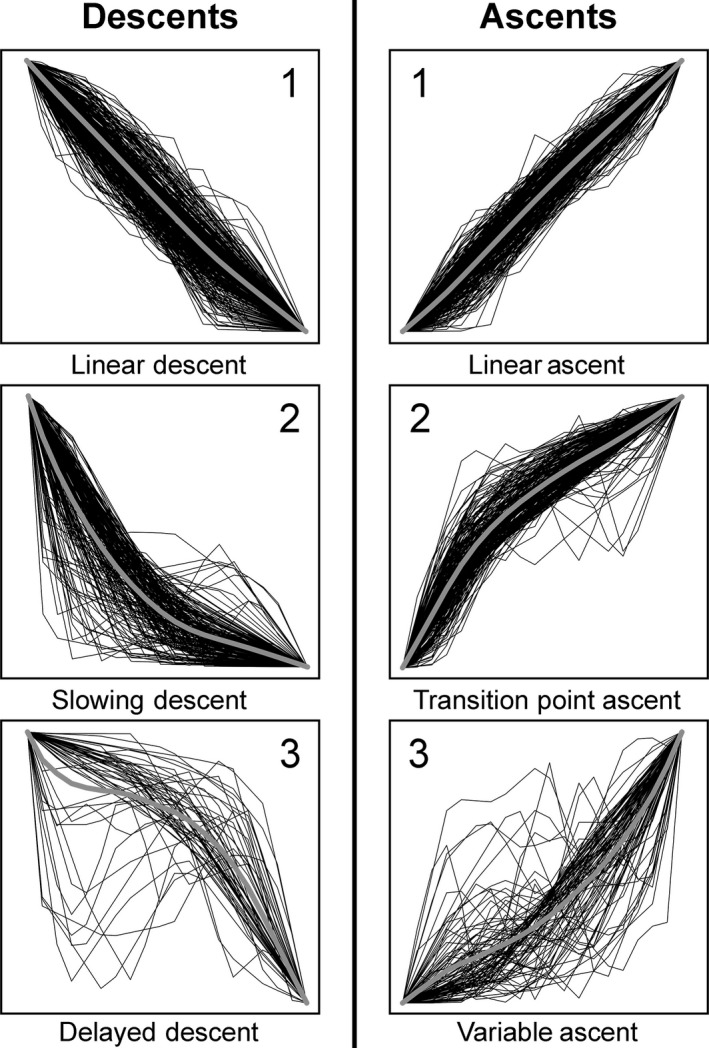
Standardized depth‐versus‐time descent and ascent profiles for each cluster. Thick gray curve represents mean profile for each cluster.

Standardized depth‐versus‐time descent and ascent profiles for each cluster. Thick gray curve represents mean profile for each cluster.