
Figure 2.
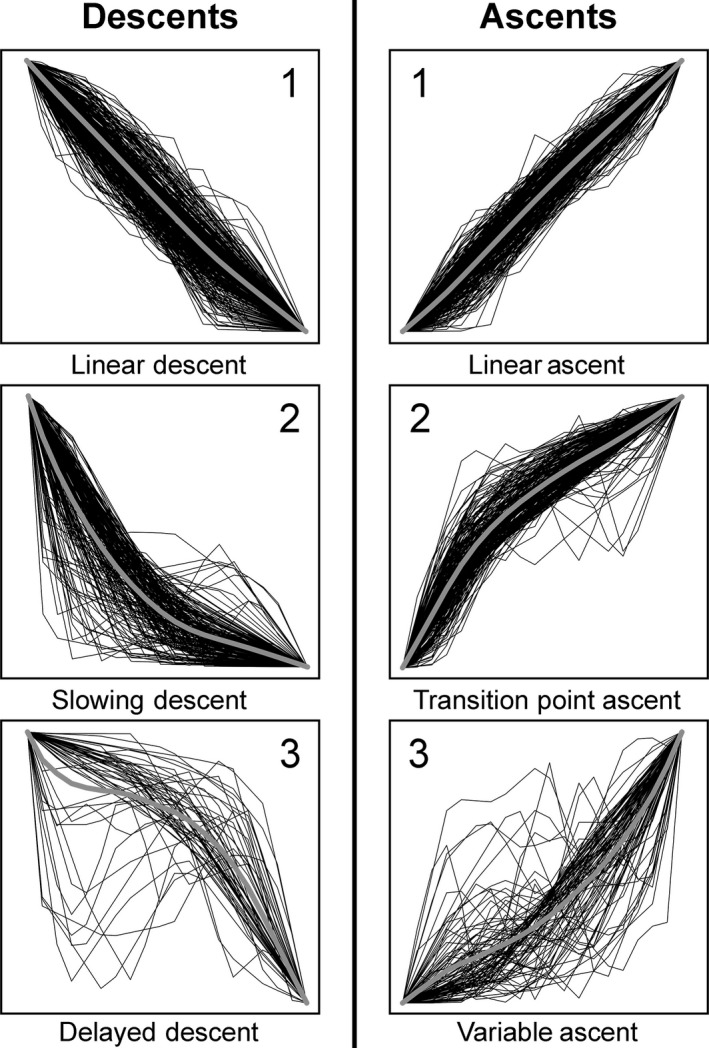
Standardized depth‐versus‐time descent and ascent profiles for each cluster. Thick gray curve represents mean profile for each cluster.
Official websites use .gov
A
.gov website belongs to an official
government organization in the United States.
Secure .gov websites use HTTPS
A lock (
) or https:// means you've safely
connected to the .gov website. Share sensitive
information only on official, secure websites.
Standardized depth‐versus‐time descent and ascent profiles for each cluster. Thick gray curve represents mean profile for each cluster.