
Figure 3.
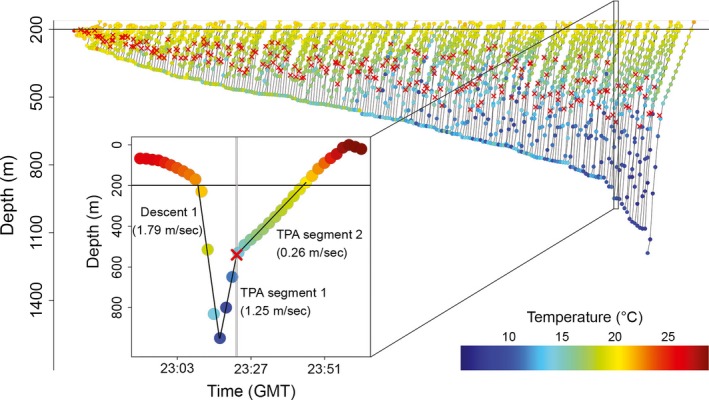
Concatenated depth‐versus‐time transition point ascents (n = 224) displayed in the order of maximum dive apex depth and colored by temperature. Red X indicates change‐point estimated by broken‐stick regression. Inset: complete mesopelagic excursion from recovered X‐Tag 107797, including nine additional records above 200 m before and after the dive event. Dive profile has linear descent (Descent 1) followed by a transition point ascent (Ascent 2). Solid black lines overlaid on the descent and ascent represent linear and broken‐stick regression model fits, respectively, and corresponding vertical velocity (linear slopes) are indicated. Change‐point confidence intervals (95%) indicated by gray vertical lines.