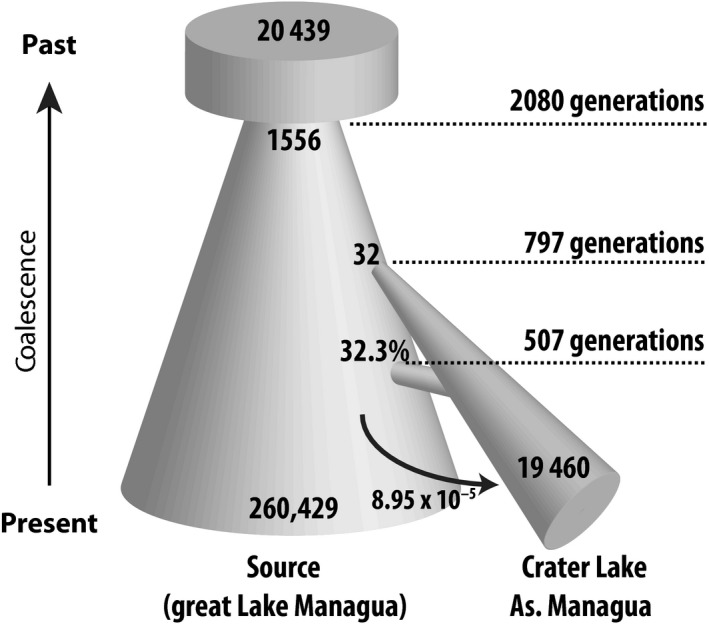
Figure 5.

Schematic depiction of the most supported demographic model and the associated maximum‐likelihood point estimates of demographic parameters. Numbers in the model refer to number of diploid individuals, time points refer to number of generations, and the migration rate refers to the probability for an allele to migrate into another deme (in forward time). Note that the model is not drawn in scale, but merely indicates differences in timing and population sizes. In addition, population growth was modeled to be exponential and not linear as shown here.
