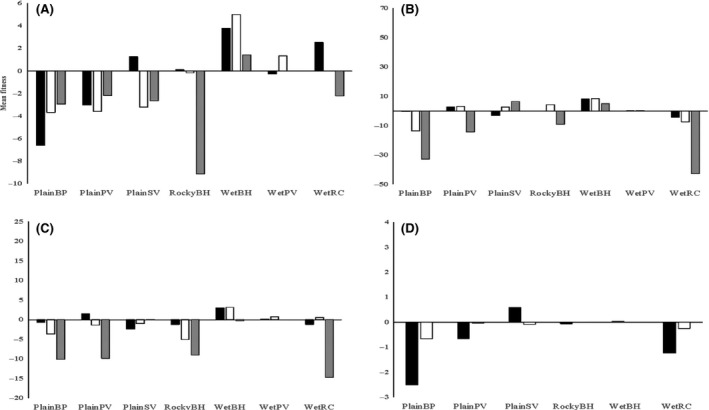
Figure 3.

Local adaptation as measured by LF (Local vs. Foreign) for various fitness measures: (A) survival, (B) plant width, (C) plant height, and (D) biomass within each of the seven field sites. Positive values indicate local adaptation, whereas negative values indicate the opposite. For Figures (A), (B), and (C), transplant phase is indicated in black, spring is indicated in white, and autumn is indicated in grey. For Figure (D), fresh weight is indicated in black and dry weight is indicated in white.
