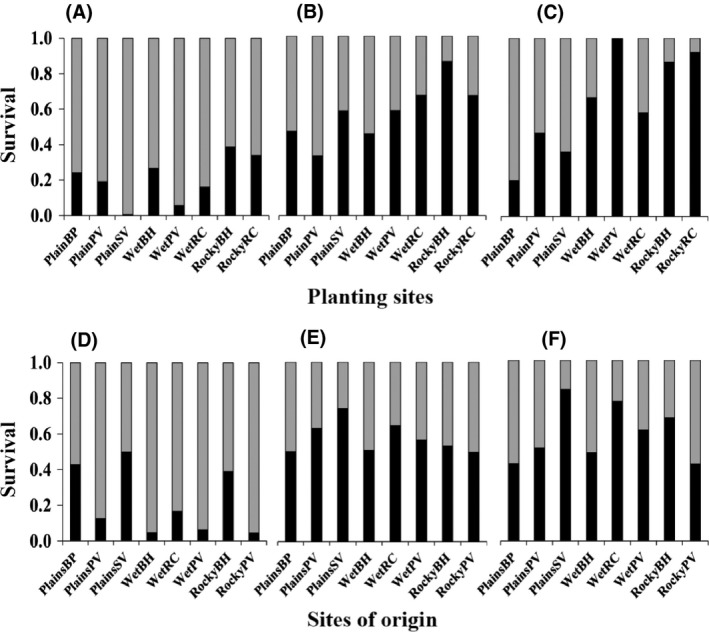
Figure 4.

Survival of seedlings at three census points (A) after transplanting, (B) in spring and (C) in summer arranged by planting site, and (D) after transplanting, (E) in spring and (F) in summer arranged by site of origin. Stacked bars show the proportion of plants alive (grey) or dead (black). These are plotted separately for the planting sites and the sites of origin at each census point. Note that only the survivors at the transplant census point are included in the spring assessment, and only the survivors at the spring census point are included in the summer assessment.
