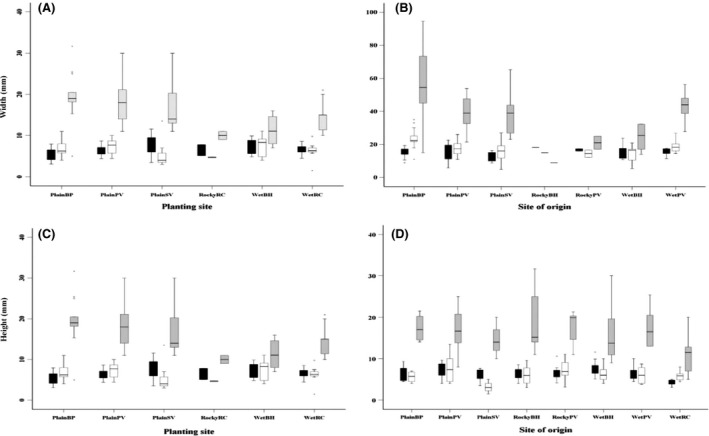
Figure 5.

Box plots for plant width (A, B) and plant height (C, D) at three census points (after transplanting, in spring, autumn) plotted for different planting sites (A, C) and sites of origin (B, D) for the field experiment. The length of each box is the variable's interquartile range containing 50% of the data. The thick black line across each box represents the median value, the protruding lines on each box represents the smallest and largest values. Outliers (o) are values extending 1.5 box lengths from the edge of the box and extreme values (*) extend more than 3 box lengths from the edge of the box. Note due to high mortality, RockyBH and WetPV are not shown on the planting sites (A, C).
