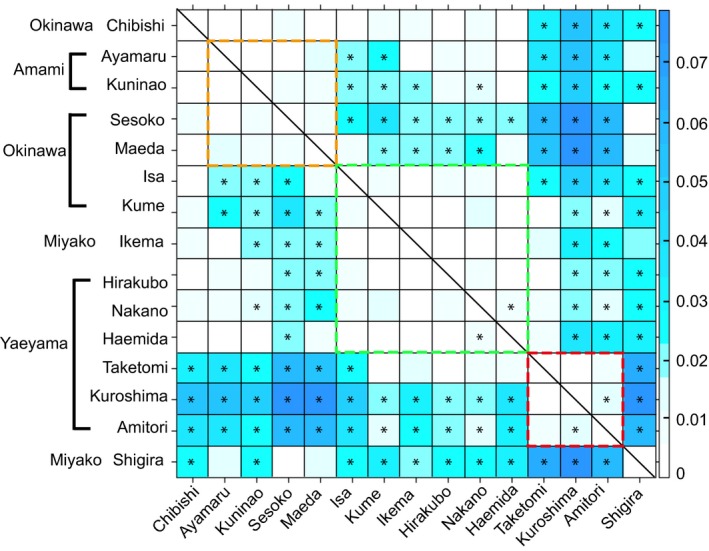
Figure 4.

Three rough genetic clusters (dashed squares) were distinguished based on pairwise F ST values among 15 sampling locations of Acropora tenuis. The heatmap color code denotes the magnitude of F ST values (right). The combination with an asterisk was significant (P < 0.05, AMOVA, Appendix S6).
