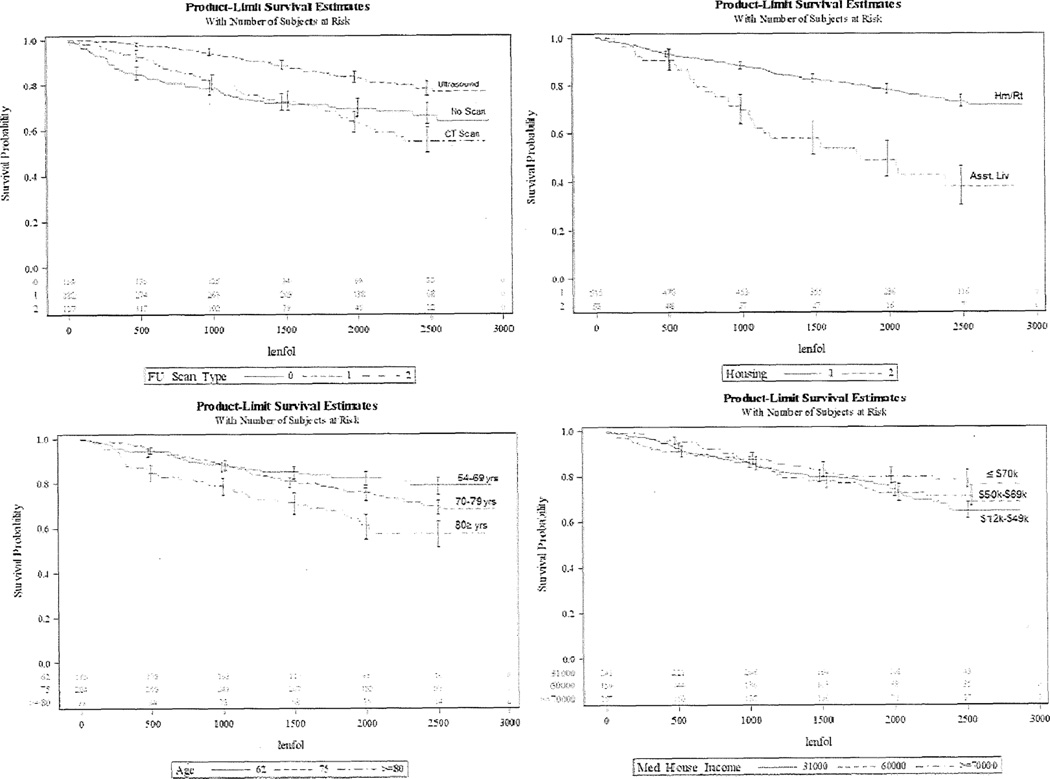
Figure 1. Patient Factors Significantly Associated with Survival Probability.
Figure displays the survival curves between survival probability and follow-up days after screening among follow-up scan type (top left), housing status (top right), age (bottom left), and estimated total median household income (bottom right). The number of patients for per follow-up interval is shown at the bottom of each graph. Age and incomes (in $ thousands) are divided each into three ranges to better visualize distribution of data. Asst Liv, Assisted Living; FU, Follow-Up; Hm/Rt, Homeowner/Renter; lenfol, length of follow-up in days; Med House Income, estimated median household income.
FU Scan Type Graph: 0=No scan, 1=Ultrasound, 2=CT Scan
Housing Status Graph: 1=Homeowner/Renter, 2=Assisted Living
Age Graph: 62=54–69 years, 75=70–79 years
Median Household Income Graph: 31000412,000–$49,000, 60000450,000–$69,000

