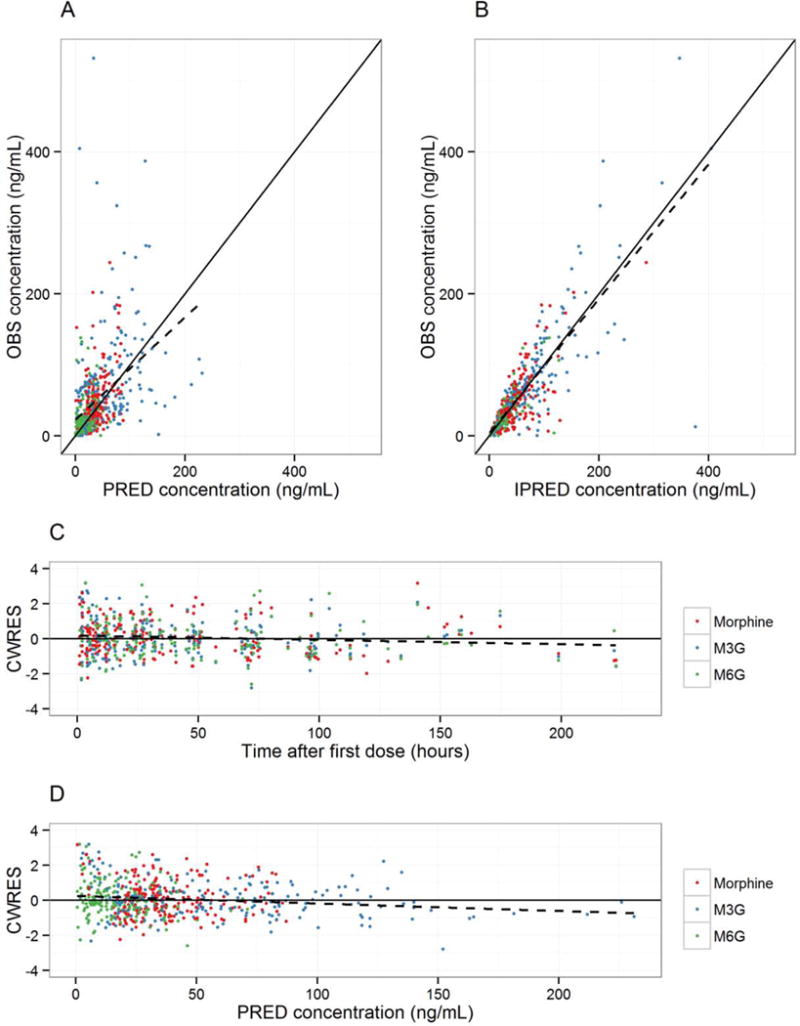
Figure 5.

Diagnostic plots for the final pharmacokinetic meta-model. The black solid lines are identity lines with a slope of 1 for plots A) and B) and a slope of 0 for plots C) and D). The black dashed lines are regression lines for the data. The red symbols represent morphine, green is M3G, and blue is M6G. Plots: A) Observed concentrations (OBS) versus population predicted concentrations (PRED). B) Observed concentrations (OBS) versus individual predicted concentrations (IPRED). C) Conditional weighted residuals (CWRES) versus time. D) Conditional weighted residuals (CWRES) versus population predicted concentrations (PRED).
