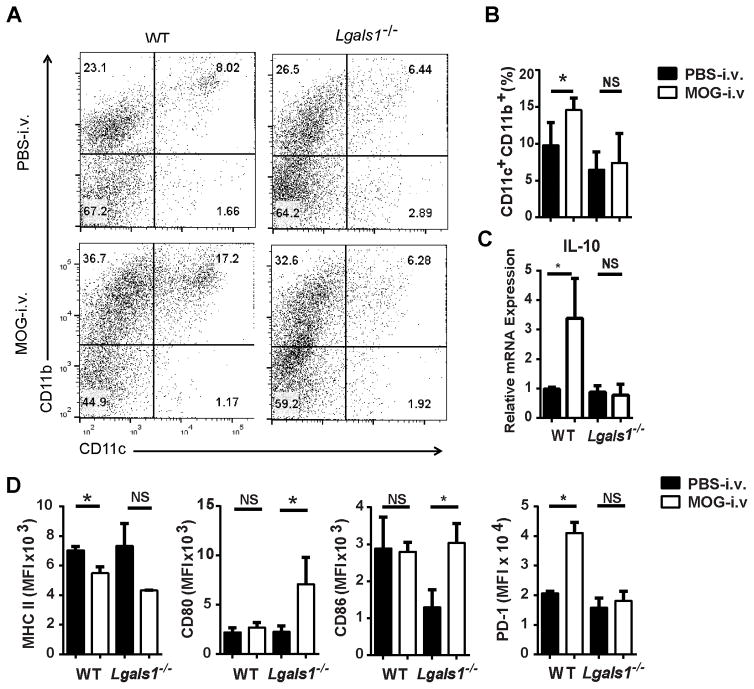
Figure 3. Lack of galectin-1 reduced numbers of tolerogenic DCs in the CNS.
MNCs were isolated from the CNS of MOG-i.v. and PBS-i.v. EAE WT (n=7) and Lgals1−/− (n=6) mice on day 25 p.i. MNCs were cultured overnight with MOG35-55, then activated with PMA/iono/GP, stained and analyzed by flow cytometry. (A) Representative flow cytometry dot plots showing CD11c and CD11b expression in MNCs. (B) Proportions of CD11c+CD11b+ DCs were determined for WT and Lgals1−/− MOG i.v. and PBS i.v. mice. (C) MFI was measured for MHC class II, CD80, CD86 and PD-1 in CD11c+CD11b+ DCs. (D) IL-10 mRNA was measured using RT-PCR. Pooled data from four experiments are shown. Experiments show mean ± SEM. *, p<0.05, unpaired Student’s t test.

