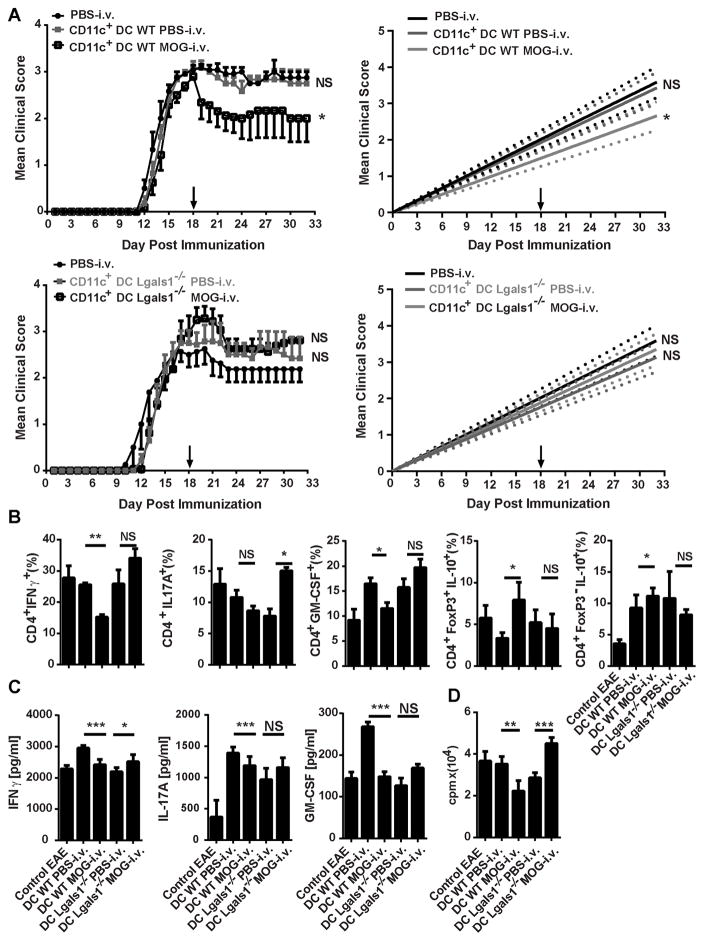
Figure 7. DCs from Lgals1−/− MOG i.v. mice do not suppress EAE.
(A) WT (n=6) and Lgals1−/− (n=6) mice were sacrificed 3 weeks after MOG35-55 i.v. tolerization. CD11c+ DCs were isolated from splenocytes and i.v. transferred into WT EAE mice (1×10⁶ mouse; n=3–5 per group) at disease peak. Mice that received PBS-i.v. served as controls. (B) Two weeks after transfer, MNCs from the CNS of DC-transferred mice and EAE controls were isolated. MNCs were cultured overnight with MOG35-55, activated with PMA/iono/GP, stained and analyzed by flow cytometry. Total numbers of infiltrating cells were gated from CD4+ population. CD4+IFNγ+, CD4+IL-17A+, CD4+GM-CSF+, CD4+IL-10+FoxP3+, and CD4+IL-10+FoxP3− percentages in CD4+ T cells were determined by flow cytometry. (C) Splenocytes from MOG-i.v. and PBS-i.v. EAE WT and Lgals1−/− mice on day 25 p.i. were stimulated for three days with MOG35-55. Cell culture supernatants were assayed for IFN-γ, IL-17A and GM-CSF by ELISA. (D) Proliferation was measured after three days of culture with MOG35-55. Tritiated adenine was added after 54 hours of culture; its incorporation was measured after 18 hours. Data shown are one representative of three experiments. Experiments show mean ± SD. *, p<0.05. For EAE, the area under the curve was calculated for each mouse and values for experimental groups were compared for statistical significance using a Mann-Whitney test for non-parametric data. Parametric data were compared for statistical significance using a two-tailed, unpaired Student’s t test.

