
Figure 3.
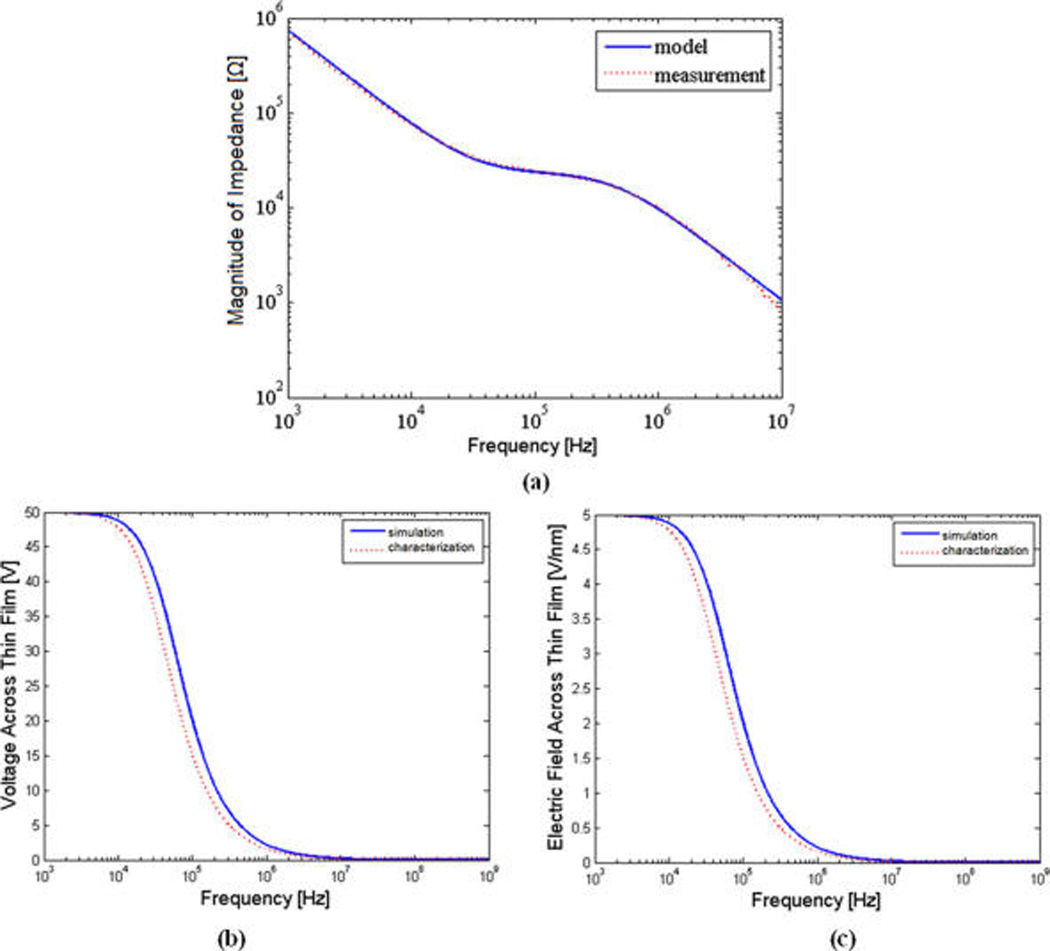
(a) Impedance spectrum (measured vs curve-fitted model) between the two neighboring electrodes in the interdigitated electrode pair. (b,c) Characterized vs simulated voltage drop spectrum (b) and electric field spectrum (c) across the deposited 10-nm SiO2 layer on the electrodes.