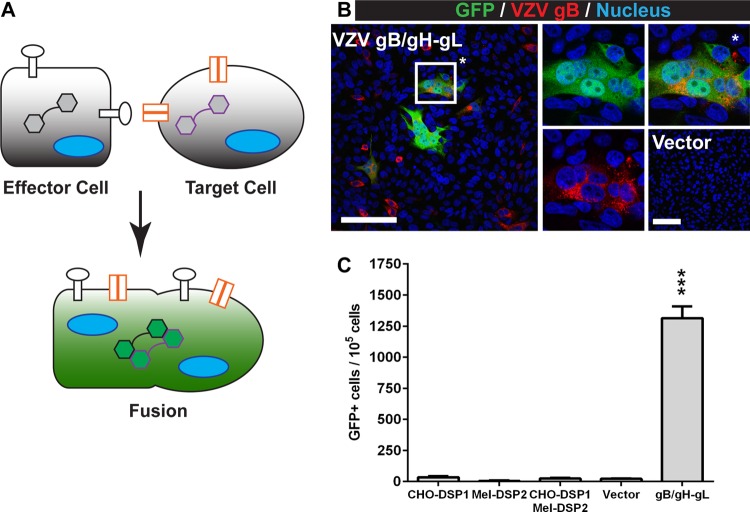
FIG 1.
Quantifying VZV gB/gH-gL-mediated fusion with the SRFA. (A) Effector cells (square) that constitutively express the DSP1 reporter (black hexagons) and transiently express the fusogen (white circles) are cocultured with target cells (circle) that constitutively express the cellular receptor(s) (orange) or coreceptors needed for membrane fusion and the DSP2 reporter (purple hexagons). Fusion between the effector and target cells (green) results in GFP and Renilla luciferase activity from the reconstituted DSP, allowing for a dual readout of fusion. Fusion events were quantified by flow cytometry. (B) Confocal micrographs of CHO-DSP1 cells expressing VZV gB/gH-gL and Mel-DSP2 cells. Cells were stained for VZV gB (red) and nuclei (Hoechst 33342; blue). Fused cells have GFP activity from reconstituted DSP1 and DSP2 (green). The merged image is on the left. The middle images are of GFP and nuclei (top) and VZV gB and nuclei (bottom). The top right image (*) is a magnification of a representative fused cell. The bottom right image is the vector control. White scale bars, 100 μm. (C) The frequency of GFP-positive cells in effectors cells only (CHO-DSP1), target cells only (Mel-DSP2), cocultured effector and target cells (CHO-DSP1/Mel-DSP2), and cocultured effector and target cells transfected with either empty vector (vector) or plasmids expressing VZV gB and gH-gL (gB/gH-gL). Values were compared to those of the vector control, and statistical analysis was performed using ANOVA (***, P < 0.001). The data shown are the mean results of four independent experiments, with bars indicating the standard error of the mean (SEM).

