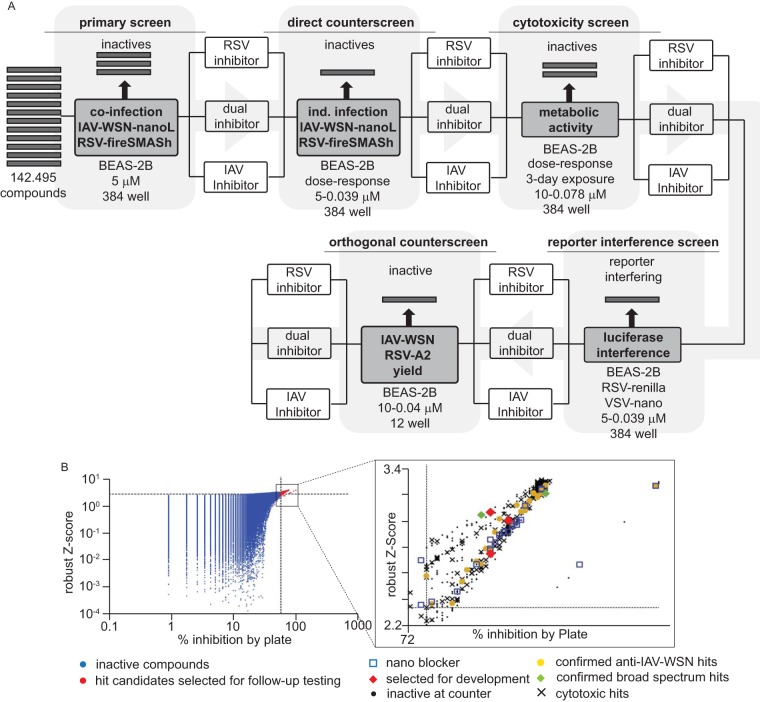
FIG 1.
Summary of the HTS campaign implemented. (A) Flow chart of the primary hit discovery and counterscreening strategies used for hit discovery and verification. (B) Primary hit identification strategy. Raw data were analyzed using both control-dependent (% inhibition by plate) and -independent (robust Z-score) approaches. Dashed lines represent hit cutoffs (75% inhibition and a Z-score of ≥3.5, respectively), and red symbols denote hit candidates (643 total) selected for counterscreening. (Inset) Summary of the counterscreening campaign. Forty confirmed IAV-specific (yellow) and two broad-spectrum candidates (green) passed the counterscreens. Three IAV-specific hit candidates (red) were selected for mechanistic characterization and development in this study.

