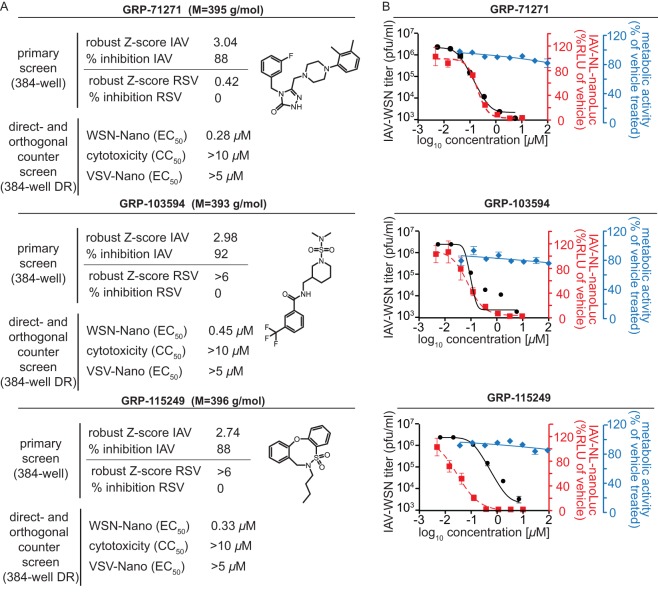
FIG 2.
Activity profiling of the three hit compounds selected for further characterization. (A) Primary screening and counterscreening results and chemical structures of the hit candidates. (B) Dose-response inhibition curves for the compounds shown in panel A for virus yield assays against IAV-WSN (black) and reporter assays against IAV-NL-nanoLuc (red). Titers and reporter signals were determined at 36 h postinfection. Curves are based on four-parameter variable-slope regression modeling. Blue symbols represent metabolic activities of uninfected host cells after 72 h of exposure to a compound. All symbols represent averages for three independent replicates ± SD.

