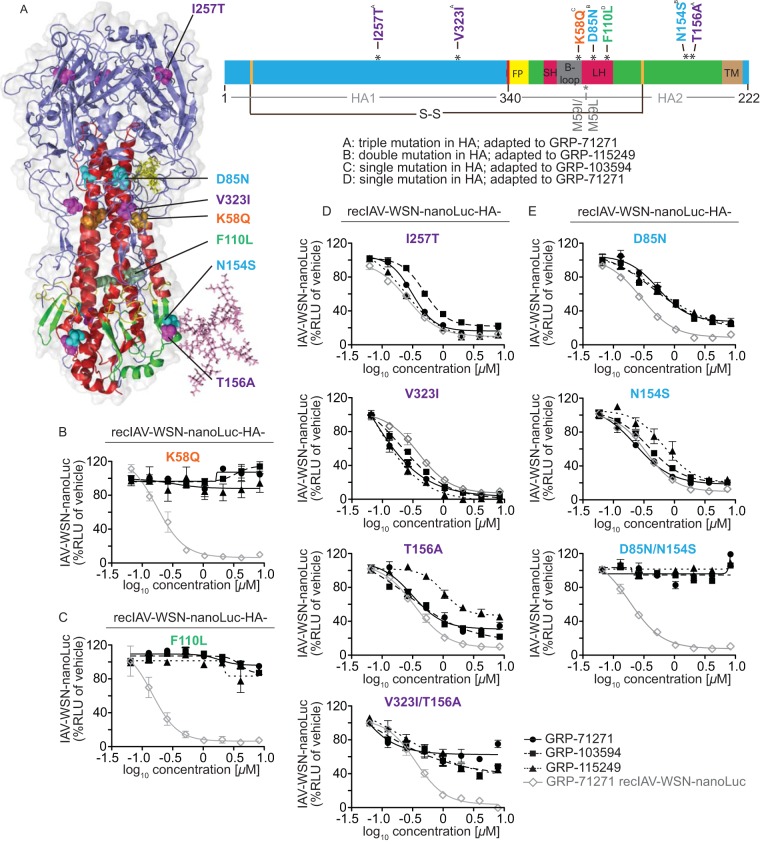
FIG 5.
Resistance profiling. (A) Ribbon model of the prefusion HA trimer (left) and linear schematic of the protein organization (right). HA1 is shown in blue, HA2 is shown in green, and individual domains in HA2 are highlighted. FP, fusion peptide; SH, small α-helix; LH, large α-helix; TM, transmembrane domain. The position of the most membrane-proximal HA stalk N-glycan is shown in the structural model for one monomer only. The positions of the disulfide bridge linking both HA subunits (S-S; black line) and of previously reported resistance mutations of structurally different HA fusion inhibitors (gray lines) are marked. (B to E) Activity testing of recombinant IAV-WSN strains harboring reintroduced specific HA mutations against all three hit compound classes. Luciferase activity was calculated at 40 h postinfection; values represent averages for three independent experiments ± SD. Where justified, four-parameter variable-slope regression modeling was applied to calculate inhibitory concentrations (summarized in Table 3). Mutations that emerged in isolation were tested individually (B and C), and mutations found together were rebuilt individually and in combination (D and E). The gray line in each graph represents reference testing of GRP-71271 against the standard IAV-WSN-nanoLuc strain.

