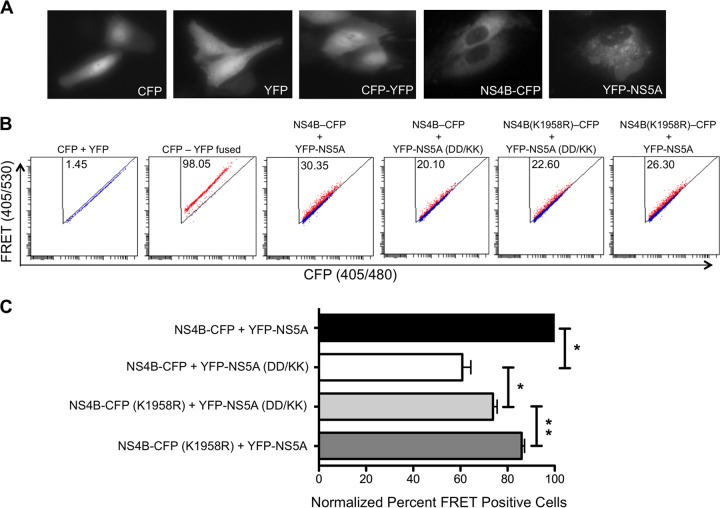
FIG 8.
FRET analysis of the interaction between NS4B and NS5A. (A) Subcellular localization of the CFP, YFP, CFP-YFP, NS4B-CFP, and YFP-NS5A proteins 24 h following transfection of Huh-7.5 cells. Images were captured at a ×40 magnification. Note that no differences are observed at the level of expression for NS4B-CFP and NS4B-CFP(K1958R) or for YFP-NS5A and NS5A(D1979K/D1982K) (data not shown). (B) Representative FACS plots showing the efficiency of the interaction between NS4B and NS5A in terms of percentages of FRET-positive cells. The experiment was repeated three times, and the average numbers of FRET-positive cells are shown in the triangular gates for controls as well as for NS4B-CFP, YFP-NS5A, and the respective mutant versions of the fused proteins. Due to space limitations, the NS5A D1979K/D1982K mutant is abbreviated NS5A(DD/KK). (C) For all three independent FRET experiments, after correcting the percentage of FRET-positive cells of the CFP- and YFP-dual-positive (i.e., cotransfected) cell population to zero, the percentages of FRET-positive cells for NS4B-CFP and YFP-NS5A were adjusted to 100%, and subsequently, the percentages of FRET-positive cells were normalized accordingly for experimental groups such as NS4B-CFP plus YFP-NS5A(D1979K/D1982K), NS4B-CFP(K1958R) plus YFP-NS5A(D1979K/D1982K), and NS4B-CFP(K1958R) plus YFP-NS5A.

