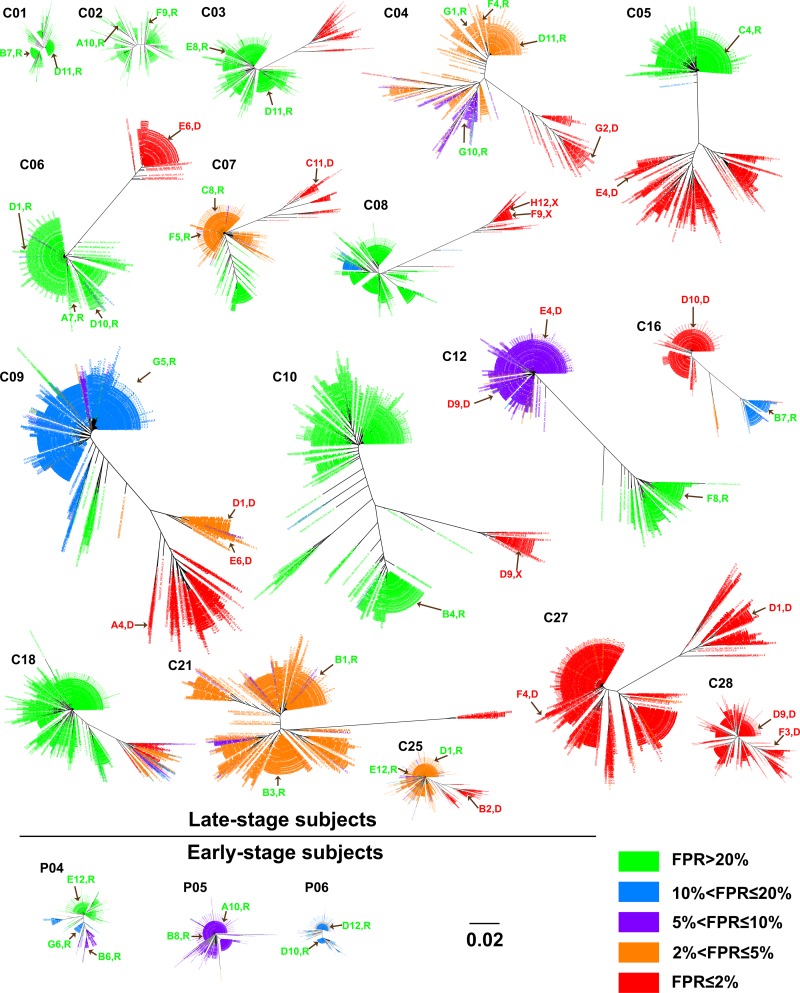
FIG 3.
Phylogenetic trees of the C2/V3 region for study samples showing different Geno2pheno[CORECEPTOR] FPRs among viral populations. Brown arrows indicate the identical or closest sequences in the tree of clones that we obtained by single-genome amplification and that were examined for entry phenotypes in vitro. Clone names and their phenotypic tropism (R, R5; X, X4; D, dual tropism) are indicted along with the arrows. The bar in the phylogenetic trees indicates the number of nucleotide substitutions per site.

