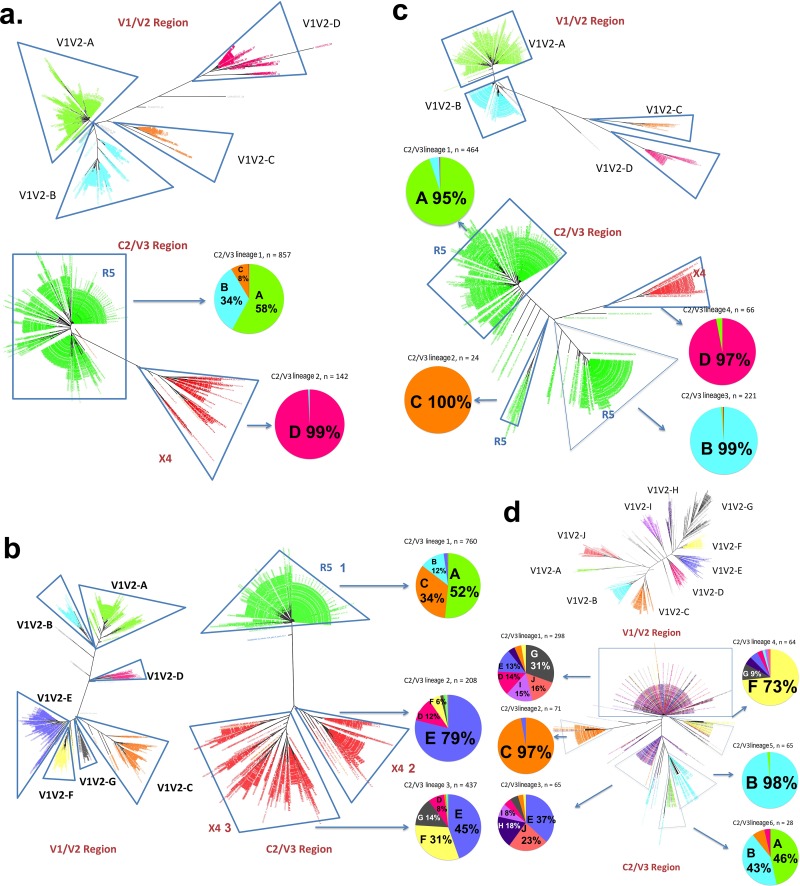
FIG 6.
Lineages of the V1/V2 region and the C2/V3 region and their recombination in 4 subjects (subjects C03, C05, C10, and P04). For samples from subjects C03, C05, and C10, lineages have the same color-codes in the V1/V2 trees and the pie charts of the major lineages of the corresponding C2/V3 trees, while the C2/V3 trees are color-coded for coreceptor tropism (red for X4 and green for R5 variants). The percentages on the pie charts show the abundances of the V1/V2 lineages in the C2/V3 lineages. In subject P04, as all variants are R5 variants, lineages have the same color-codes in the corresponding V1/V2 and C2/V3 trees. (a) Subject C03; (b) subject C05; (c) subject C10; (d) subject P04.

