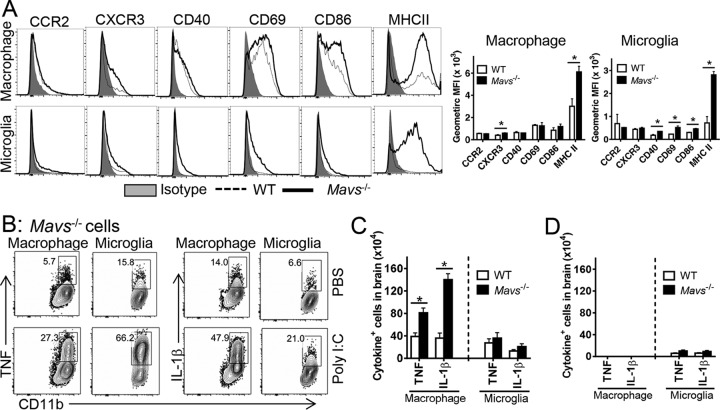
FIG 8.
Enhanced activation of macrophages and microglia in Mavs−/− compared to WT brains. WT and Mavs−/− mice were infected with 100 PFU WNV s.c. (A) Cells from brains were harvested at day 10 p.i. and stained with phenotypic markers. Geometric mean fluorescence intensities (MFI) are shown. *, P < 0.05. The data are representative of the results of 2 independent experiments. n = 3 mice/group/time point/experiment. (B) Macrophages and microglia were stimulated with 20 μg/ml poly(I·C) in the presence of BFA in vitro for 6 h and stained for intracellular TNF and IL-1β expression. (C and D) Cytokine-expressing-cell numbers in infected (C) and naive (D) mice. n = 9 mice/group/time point. *, P < 0.05. The data were pooled from three independent experiments. The error bars indicate SEM.

