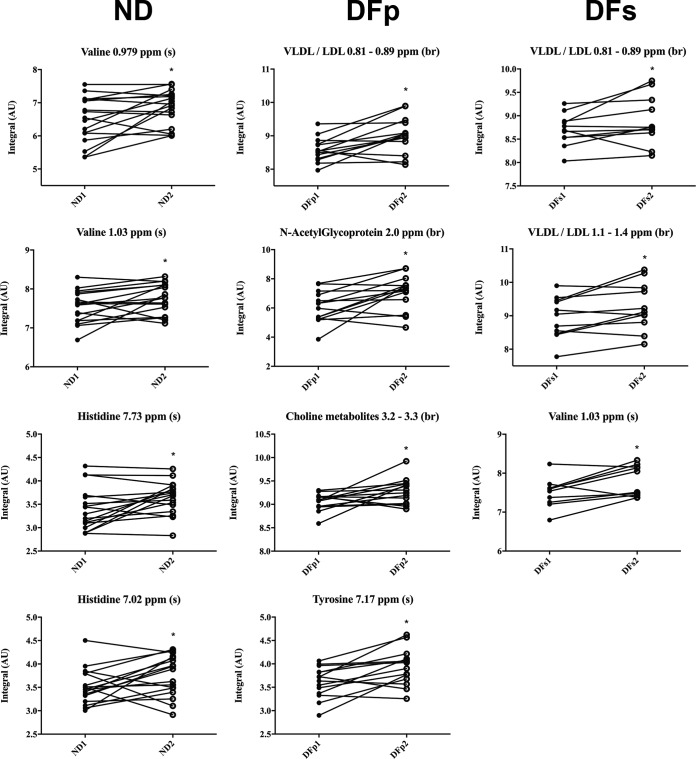
FIG 7.
Longitudinal variations of plasma metabolite concentrations observed in ND and DF subjects at the onset of symptoms and at the defervescence phase. The variations in the CPMG spectra for all compounds were measured. Numbers correspond to the onset of symptoms (indicated by the suffix 1) and the defervescence phase (indicated by the suffix 2). br, broad resonance; s, singlet; m, multiplet. *, P < 0.05, as assessed by the Kruskal-Wallis test. Significance was evaluated by Dunn's multiple-comparison test.

