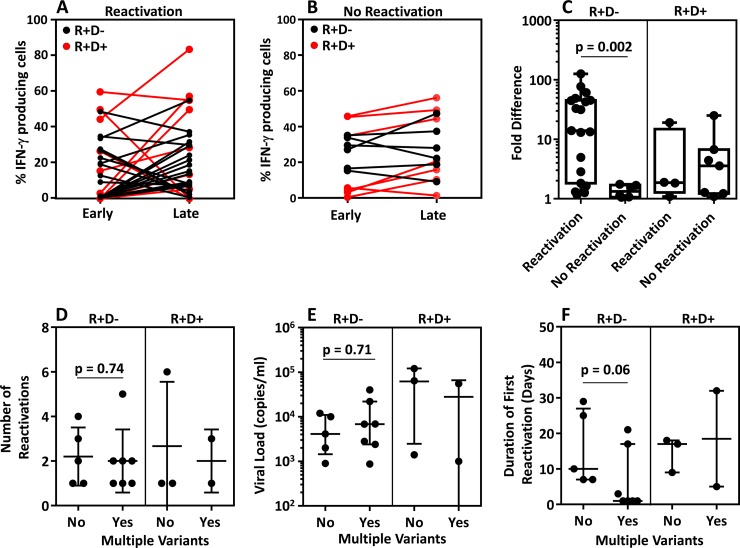
FIG 5.
Effect of coinfection on viral reactivations and association of viral reactivation with overall T cell immunity. (A to C) Pairwise analyses of the frequency of IFN-γ-producing T cells generated against individual epitopes from HSCT recipients showing evidence of reactivation (A) or with no evidence of reactivation (B) are shown. Responses are only shown when epitope-specific T cells were detected in at least one time point. Data in red represent R+/D+ patients, and data in black represent R+/D− patients. Fold difference (C) was calculated by dividing the higher frequency of IFN-γ-producing T cells, at either time point, by the lower frequency detected at either time point. (D to F) HSCT recipients were grouped based upon whether they showed evidence for exposure to multiple variants. (D) Data represent the number of reactivations in HSCT recipients with and without evidence of coinfection. (E) Data represent the viral load during primary reactivation. (F) Data represent the duration, in days, of the primary reactivation.

