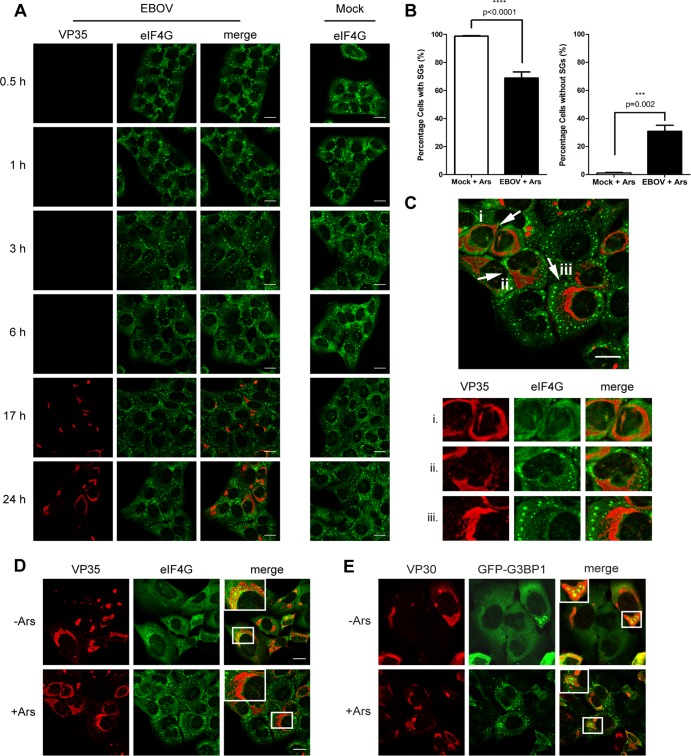
FIG 6.
SGs are reduced late during EBOV infection. (A) U2OS cells were mock infected or infected with EBOV at an MOI of 1.5. At the indicated time points p.i., cells were treated with 0.5 mM Ars for 30 min, fixed, and examined by IF analysis using antibodies against eIF4G (green) and VP35 (red). (B) Quantification of SG-containing cells at 24 h p.i. Counting was performed for three separate experiments. For each experiment, 24 random fields were counted containing total numbers of 290, 187, and 262 cells, respectively. Counting was performed twice by different lab members. Statistical analysis was performed by GraphPad Prism software, using an unpaired two sample t test. (C) Representative fields showing the three outcomes of SG induction observed in EBOV-infected U2OS cells at 24 h p.i., shown zoomed 1.4× below with separated color channels. (D) U2OS cells were infected with EBOV as described for panel A. At 24 h p.i., cells were treated with 0.5 mM Ars for 30 min. Accumulation of SG proteins within viral inclusions was examined by staining for VP35 (red) and eIF4G (green). Boxed areas are shown zoomed 2× in insets. (E) U2OS-GFP-G3BP1 cells were infected as for panel D but treated with 1 mM Ars for 30 min. Cells were stained for VP30 (red), and G3BP1 was visualized by its GFP tag. Boxed areas are shown zoomed 1.5× in insets. Scale bars = 20 μm.

