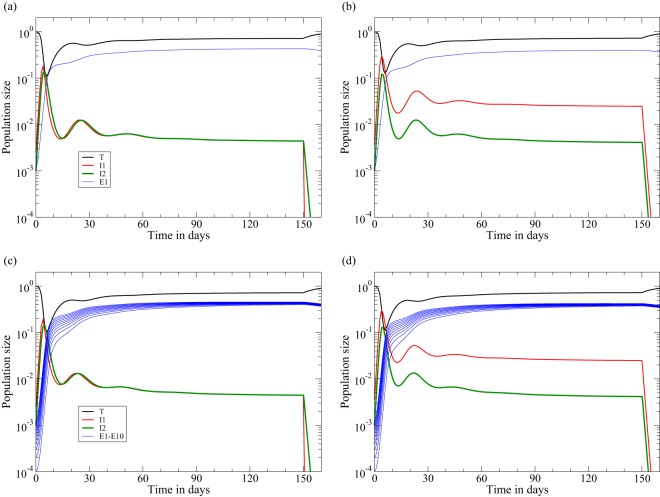
FIG 1.
Acute infection followed by ART at day 150 in the two-stage model of equation 8. The behaviors of the early killing regime (a and c) and of the late-killing scenario (b and d) are shown. Data are shown for 1 immune response, with k1 = 10 (a and b), and 10 immune responses, with ki = 1 for i = 1,2,…,10 (c and d). The rate at which the viral load, V ∝ I2, increases during acute infection is 1.5 day−1 in both cases, and the rate at which it decreases during ART is approximately δ = 1 day−1. We use the function F(T) = s − dTT to complete equation 7a for the target cells and set s = dT to scale the uninfected steady state to one and the function G(Ei,V) = pVEi/(hi + V + Ei) with V = I2 to complete equation 7b of the CTL (39, 47). We here set k1 = 10 day−1 or ki = 1 day−1, hi = i/1,000, and Ei(0) = 0.001/i for i = 1,2,…,n. For the early killing scenario, we set β = 8.75 and d1 = d2 = 1, and for the late-killing regime, we set β = 9.1, d1 = 0.1, and d2 = 2 day−1 (Table 1). By equation 13, both settings account for a realistic initial replication rate in macaques of ρ(0) = 1.5 day−1. See Table 1 for all other parameter values.

