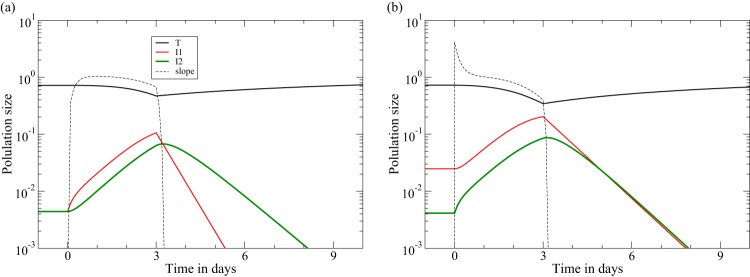
FIG 4.
CD8+ T cell depletion at day zero is followed by ART at day three (11, 12). We start the model in the chronic states from Fig. 1 (using the same functions and parameters). The dashed line provides the rate of increase of the productively infected cells, dI2/dt/I2, and confirms that the initial rate at which the viral load increases reflects the steady-state killing rate in the late killing regime (K = 4.0) (b) but not in the early killing regime (a). In both regimes, the rate at which the viral load increases rapidly approaches the effective replication rate of ρ ≃ 1 day−1, until the target cell numbers decline. Due to our design of the parameters d1 and d2, the downslope of the viral load during ART remains δ ≃ 1 day−1 in both regimes (see Table 1).

