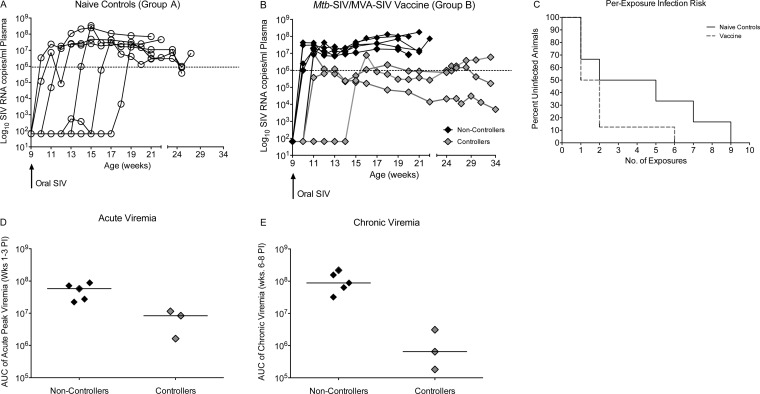
FIG 1.
Challenge outcome after repeated low-dose oral SIVmac251 exposure. (A and B) Plasma viremia in naive controls (A) and vaccinated animals (B). Starting at week 9 of age (black arrow), animals were exposed once weekly with 5,000 TCID50 of SIVmac251 by the oral route. Naive animals are shown as open circles, vaccinated animals with high and uncontrolled viremia (noncontrollers) are represented by black diamonds, and vaccinated animals that could partially control viremia (controllers) are shown as gray diamonds. The dashed line at 106 copies of SIV RNA/ml plasma indicates the threshold to define partial control of viremia in the current study, because most of the nonvaccinated animals had higher peak and chronic viremia throughout the study period. (C) Representing the per-exposure risk of SIV infection in naive control and vaccinated infant macaques, the Kaplan-Meier survival plot shows the percentage of naive and vaccinated animals that remain uninfected after each oral SIV exposure. (D) Median acute viremia (horizontal line), defined as area under the curve (AUC) of plasma viremia from weeks 1 to 3 post-SIV infection (PI) in controller and noncontroller animals of group B. (E) Analogous to panel D, but showing differences in early chronic viremia, defined as the AUC of plasma viremia between weeks 6 and 8 post-SIV infection in controller and noncontroller group B animals. Each symbol represents an individual animal.

