
Figure 1.
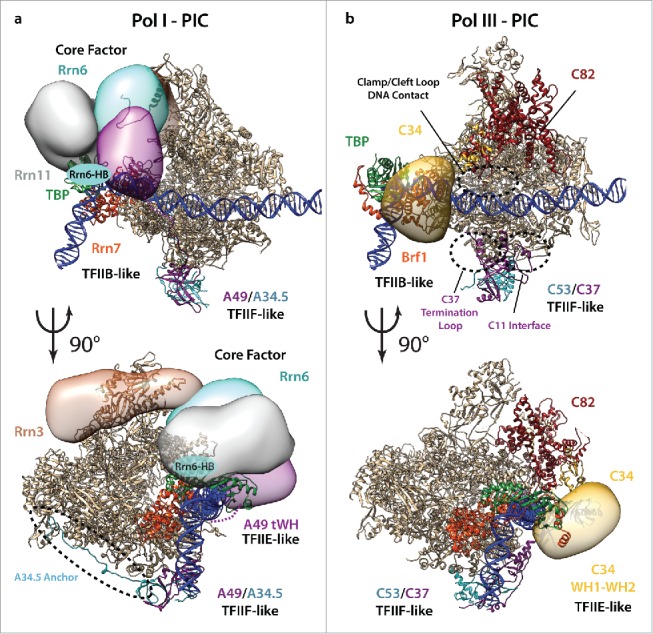
PIC—models for Pol I and Pol III. (a) Model of a Pol I–PIC depicting the TFIIB-, TFIIF-, and TFIIE-like factors together with core factor in a closed PIC. Pol I specific proteins except TBP are shown in color and adaptations are marked with black-dotted circles. The Pol I crystal structure (4c3i), the Pol II-TFIIB-TFIIF initial transcribing structure (4v1n), the Rrn3 crystal structure (3tj1) and the Pol II –PIC map (EMDB 3115) were used to model proteins and the DNA, and positioning of the CF proteins and Rrn3 was additionally aided by available crosslinking data24,32 and the described A43-Rrn3 and Rrn3-Rrn6 interactions.33 (b) Model of a Pol III—PIC highlighting Pol III specific TFIIB-, TFIIF-, and TFIIE-like factors. C82 is shown in red. Unique adaptations are depicted with black circles, the tentative position of C34 WH domains 1 and 2 is shown as yellow circles. The Pol III structure (5fja), the Brf2-TBP structure (4roc) and the Pol II –PIC map (EMDB 3115) were used to generate the model. Subunits and domains that could be positioned only approximately (Rrn3, 6, 11, C34-WH1 and WH2, and A49-tWH) are depicted schematically as low-resolution localization densities.