
Figure 1.
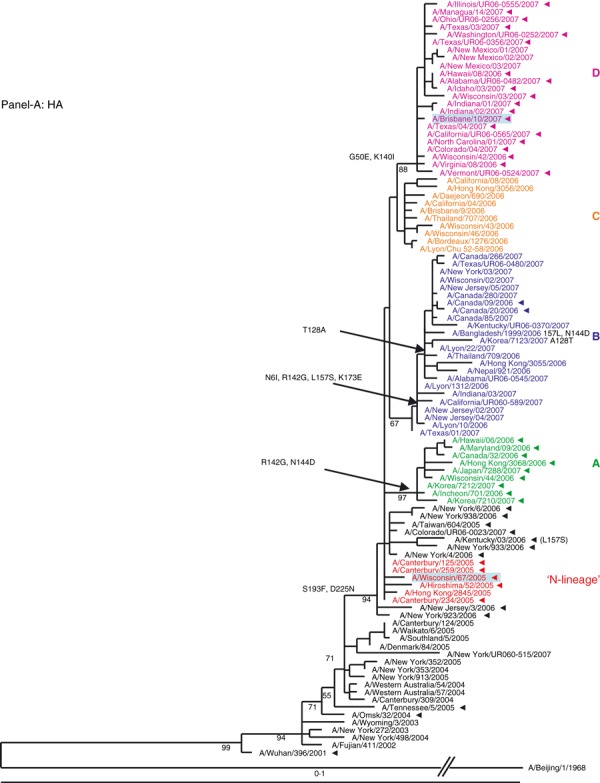
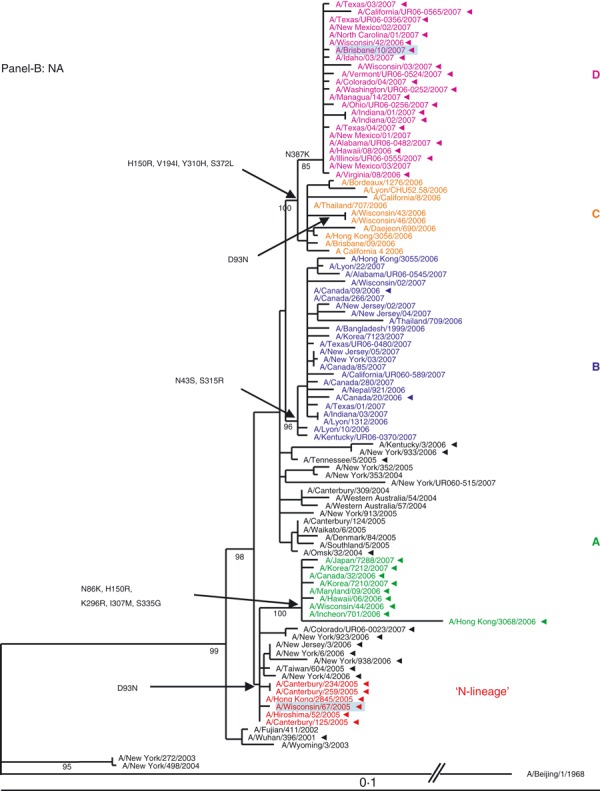
(A, B) Evolution of the surface antigens HA1 and NA genes of A(H3N2) viruses sampled during the 2006–2007 season. Phylogenetic tree was constructed from the HA1 genes of viruses sequenced during the study (n = 64) and 36 viruses with full genome sequences available in public domain. Trees were inferred using maximum likelihood available in garli 0·96b7 package. Using paup package bootstrap values, shown on tree branch nodes, were calculated from 100 replicates using of the data set to ensure robustness of the analysis (the results and parameters for each segments data set are available upon request). Phylogenetic trees throughout the manuscript were rooted with A/Beijing/1/1968, which was used as an out‐group. For clarity, the N‐lineage and four major genetic clades A–D are color‐coded in all figures according to their respective HA clade (N‐lineage – red, clade A – green, B – blue, C – orange, and D – purple). Characteristic amino acid changes are shown at the appropriate nodes. Vaccine strains for 2006–2007 and 2007–2008 seasons, A/Wisconsin/67/2005, and A/Brisbane/10/2007, respectively, are highlighted in light blue. Solid arrowheads indicate resistance to adamantanes.