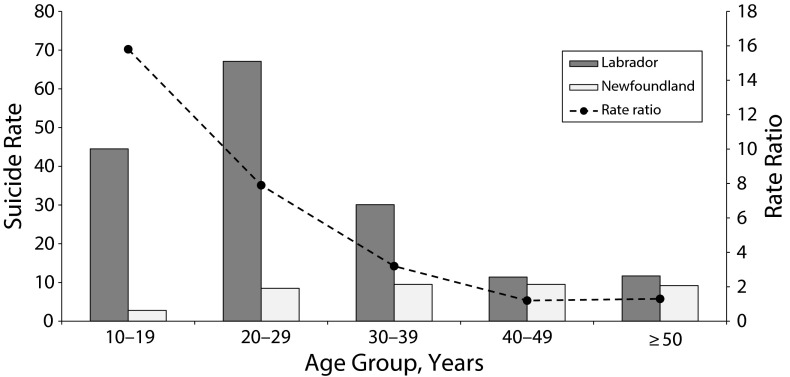
FIGURE 1—
Crude Suicide Rates and Rate Ratios by Age Group: Labrador and Newfoundland, Canada, 1993–2009
Note. Suicide rates are crude rates per 100 000 person-years. Results including rate ratio 95% CIs are reported in Table B (available as a supplement to the online version of this article at http://www.ajph.org).

