Figure 1.
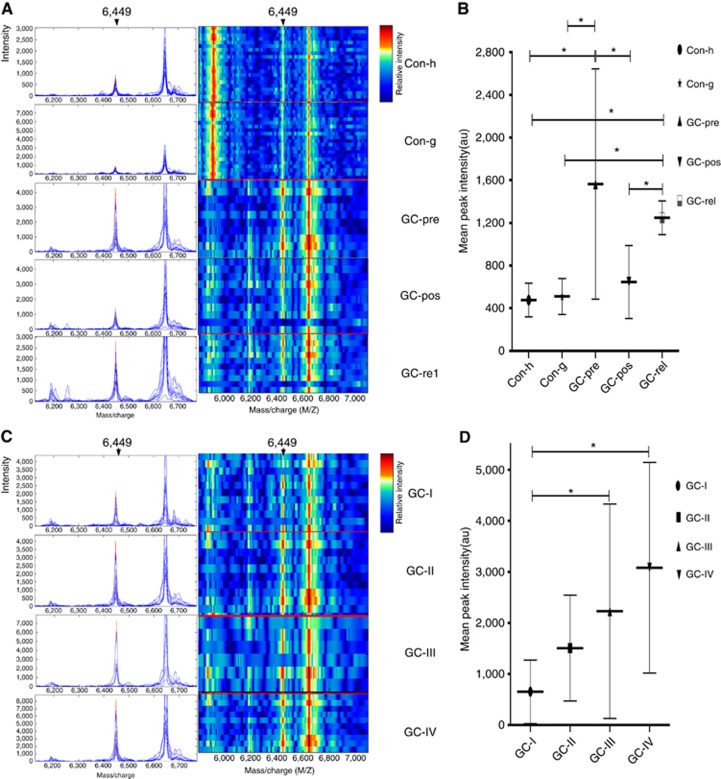
Representative expression map of SELDI-TOF-MS analysis of sera from GC patients and healthy controls in the mining set. (A) Representative expression of the peak at 6449 Da (left panel, arrow) and gel views (right panel, arrow) from control (Con-h: healthy donors as control; Con-g: gastritis donors as control), preoperative GC (GC-pre), corresponding postoperative GC (GC-pos) and relapsed GC (GC-rel) patient sera; (B) The peak at 6449 Da was significantly elevated in preoperative GC patient sera, compared with the control, decreased in postoperative and upregulated again in relapsed GC samples, (493.010±163.037 vs 1563.664±1080.217 vs 644.712±342.500 vs 1247.915±157.747; P<0.05); (C) Typical expression of the 6449 Da peak (left panel, arrow) and gel views (right panel, arrow) at different stages of GC (GC-I: patient with stage I GC; GC-II: patient with stage II GC; GC-III: patient with stage III GC; GC-IV: patient with stage IV GC); (D) The level of the 6449 Da protein progressively increased with clinical stages I, II, III and IV (649.724±620.964 vs 1506.884±1036.531 vs 2229.2995±2099.2703 vs 3081.431±2063.393; P<0.05). *P<0.05.

