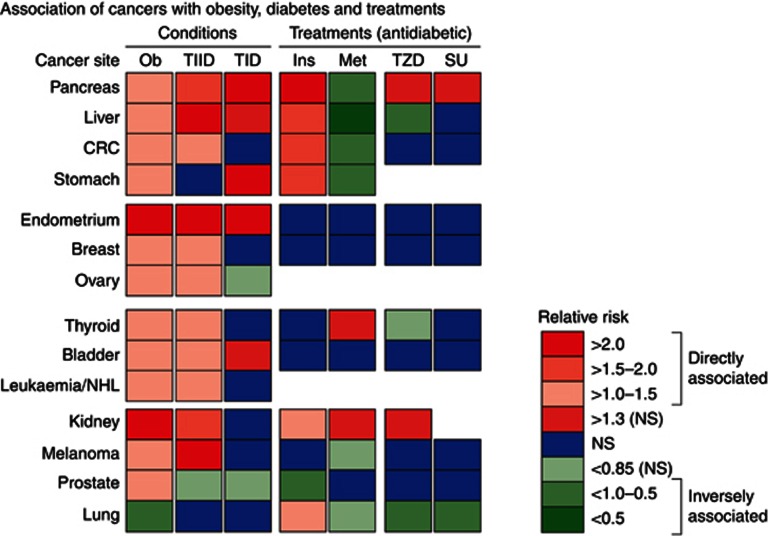
Figure 1.
Association of cancers (classified by site) with obesity, diabetes and treatments. Raw data for this figure are presented in Supplementary Tables S1 and S2. Cancer relative risk was directly – red colours – or inversely (protection) – green colours – associated with obesity (Ob), TIID, TID or ADTs: insulin (Ins) and sulphonylurea (SU) that increase circulating insulin and metformin (Met) and TZDs that decrease blood glucose. Not statistically significant (NS) association (blue squares). Squares with very light red or green shadow represent trends to direct (red shadow) or inverse (green shadow) association, although statistically not significant mainly because of lack of sufficient studies.

