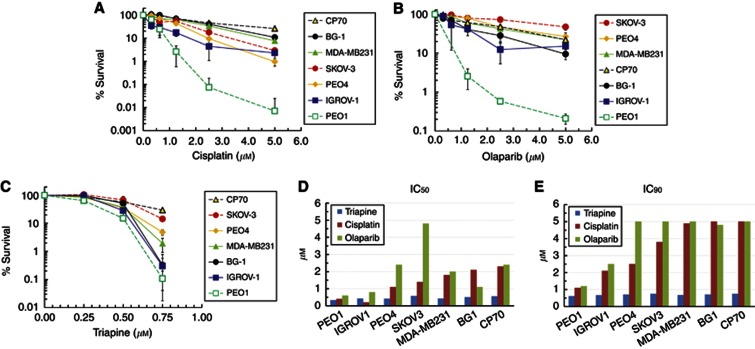
Figure 1.
Sensitivity profiles of breast cancer and EOC cell lines to cisplatin (A), olaparib (B), and triapine (C). Cells were plated and treated continuously with various concentrations of the indicated agents. After 10–21 days, colonies were stained and clonogenicity was determined. Data are means±s.d. Comparison of IC50 (D) and IC90 (E) of triapine, cisplatin, and olaparib among cancer cell lines. Inhibitory concentrations of triapine, cisplatin, and olaparib at 50% and 90% of clonogenic survival (IC50 and IC90) were determined from the dose response curves shown in (A–C).

