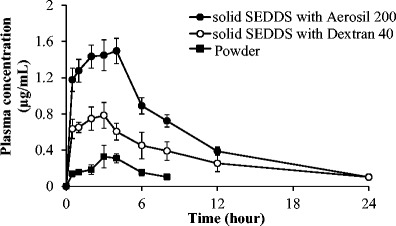
Fig. 7.

Plasma concentration–time profiles of erlotinib after oral administration of powder and solid SEDDS formulations in rats. Each value represents the mean ± S.D. (n = 4). Erlotinib powder (black square), solid SEDDS prepared with dextran 40 (white circle), and solid SEDDS prepared with Aerosil® 200 (black circle)
