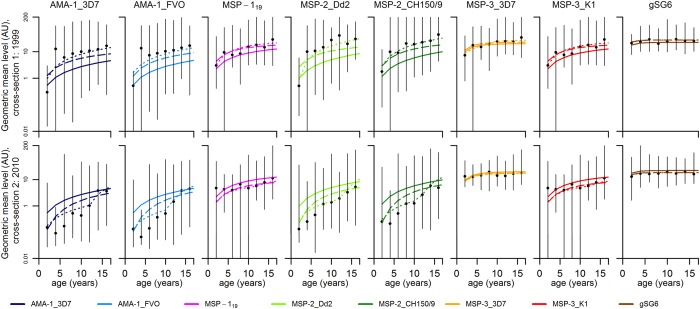
Figure 4. Best-fit antibody acquisition models.
Black points denote geometric mean antibody levels in arbitrary units (AU) and vertical bars denote the 95% range of the data. Model 1: stable transmission (solid lines). Model 2: stepwise reduction in transmission (dotted lines). Model 3: linear reduction in transmission (dashed lines).

