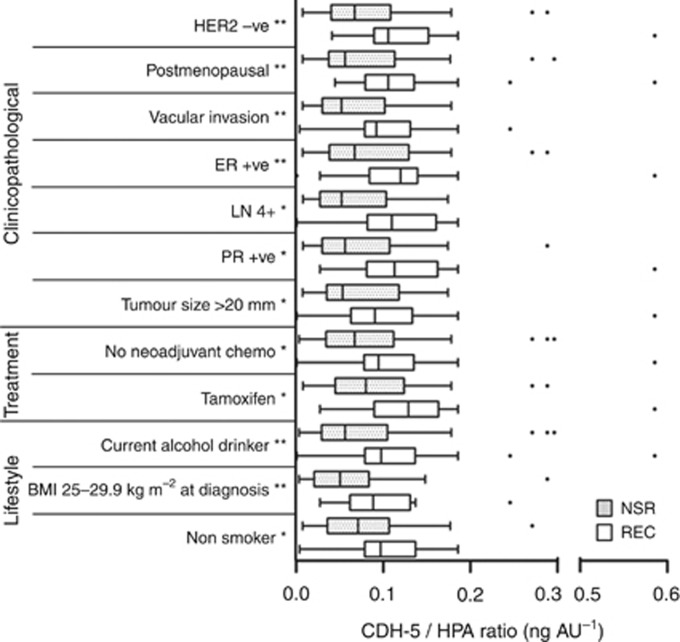
Figure 3.
Box plots showing clinicopathological, treatment and lifestyle factors (listed from most to least significant) that distinguish NSR and REC patients when their ratio of CDH5:HPA binding is assessed. The whiskers represent data within 1.5 IQR of the upper and lower quartiles. Outliers are indicated by dots. Significance identified using Mann–Whitney or the Kruskal–Wallis tests are indicated **P<0.01, *P<0.05.

