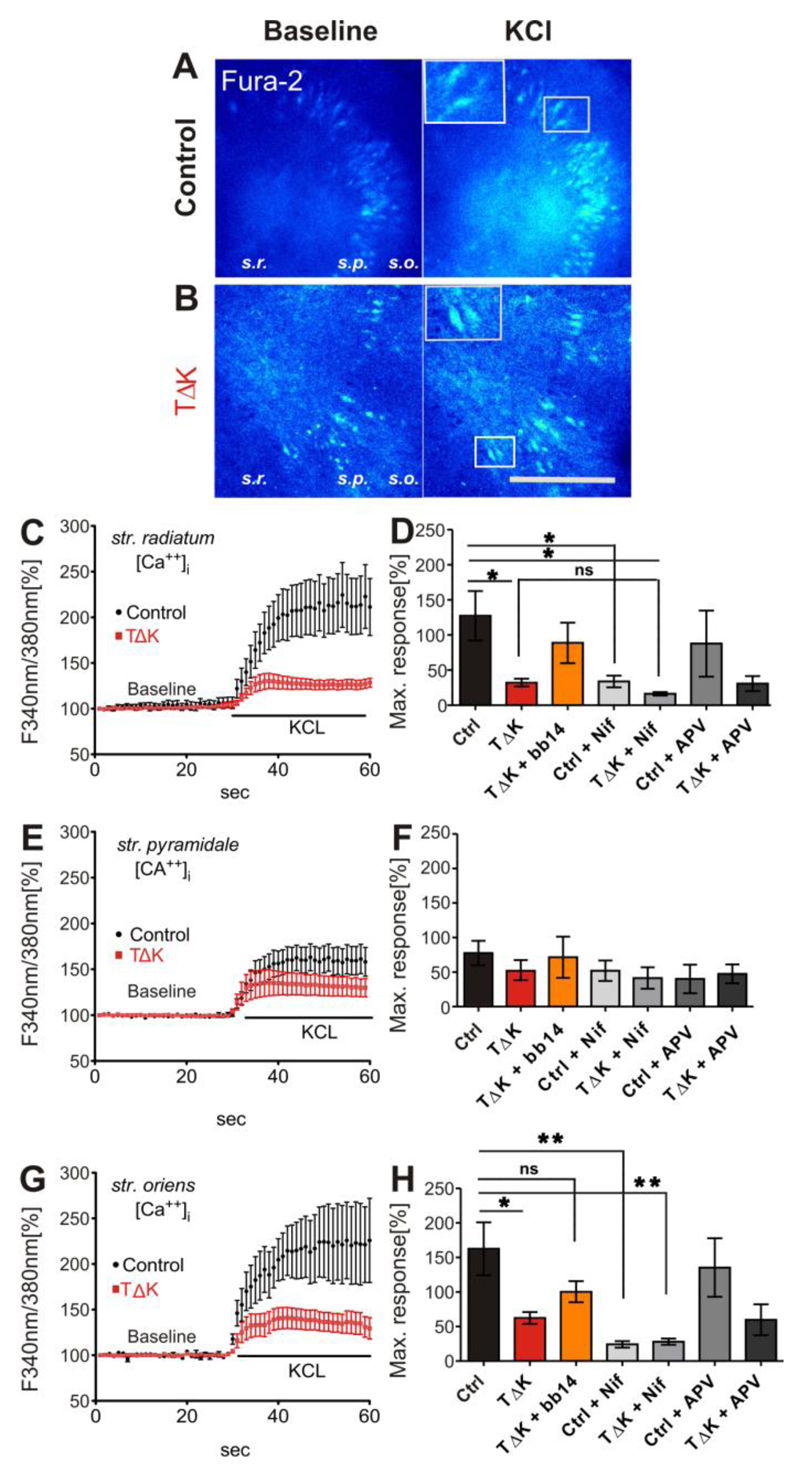
Fig. 5. TauRDΔK attenuates Ca++ dynamics in area CA3.
(A, B) Slices (DIV15) from control (A) and TauRDΔK mice (B) were loaded with the Ca++ indicator Fura-2AM. Ratio images (F340nm/380nm) are presented before membrane depolarization (baseline) and at the peak response to KCL application. Fura2-AM loading resulted in fluorescence of neurons as shown in the insets of A and B. The layers of area CA1-CA3, stratum radiatum (s.r.), stratum pyramidale (s.p.) and stratum oriens (s.o.) were analyzed consecutively.
(C, E, G) show the mean time course of [Ca++]i changes in response to high KCl. After depolarization [Ca++]i rises up to 250% of the initial levels in control slices (n=7, 4 different animals) in apical (s.r.) and basal (s.o.) dendrites. Cell somata in s.p. showed lower Ca++ responses (170%; n=7, 4 different animals). In contrast, in TauRDΔK slices the Ca++ response was strongly attenuated in peak responses of all three layers (only 130%; averaged value; n=7, 4 different animals).
(D, F, H) Quantification of the maximum peak increase in intracellular Ca++ concentrations after high KCL stimulation. The strongest increase in [Ca++]i was observed in s.r. (ctrl 227%) and s.o.(ctrl 262%) whereas in s.p. the Ca++ response was only 177%. In TauRDΔK slices the maximum response was strongly attenuated in str. radiatum (F(6/29)=3.796; p<0.05) and str. oriens (F(6/25)=5.056; p<0.05). This effect was partly rescued in the presence of bb14. The inhibition of L-VGCC by nifedipine (Nif, 20µM) inhibited the Ca++ influx of control slices to similar values as in TauRDΔK slices without nifedepine apllication. The effect of nifedipine in TauRDΔK slices was less prominent (n=5) compared with control slices. The application of the NMDAR blocker APV (100µM) reduced Ca++ influx only slightly in both control and in TauRDΔK (n=3 and n=4 respectively). One-way ANOVA followed by Tukey’s post-hoc test: * p- value < 0.05, ** p-value < 0.01. Scale bar in A/B: 200µM

