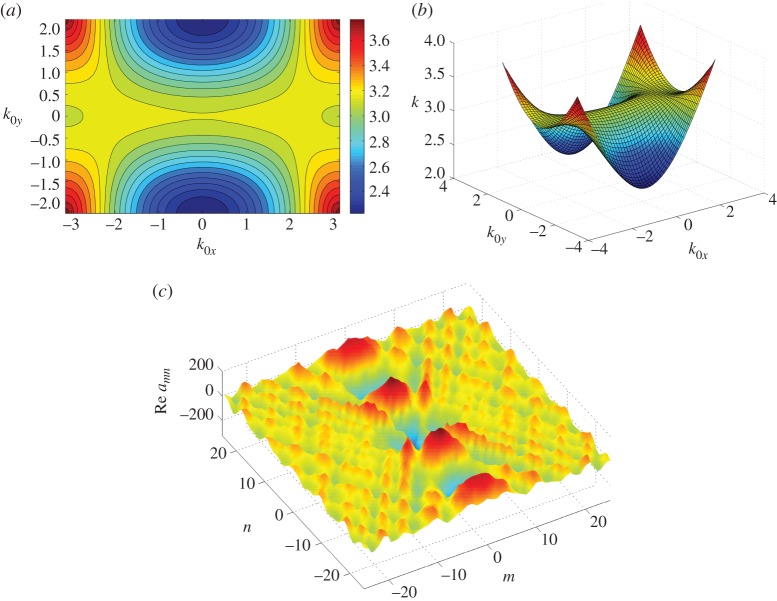
Figure 11.
(a) Contour and (b) surface plot for the first dispersion surface corresponding to over the entire Brillouin zone. The amn coefficients showing the forces imposed (to enforce pinned conditions) at k=3.069 are given in (c) and correspond to a localized mode along the y axis. (Online version in colour.)

