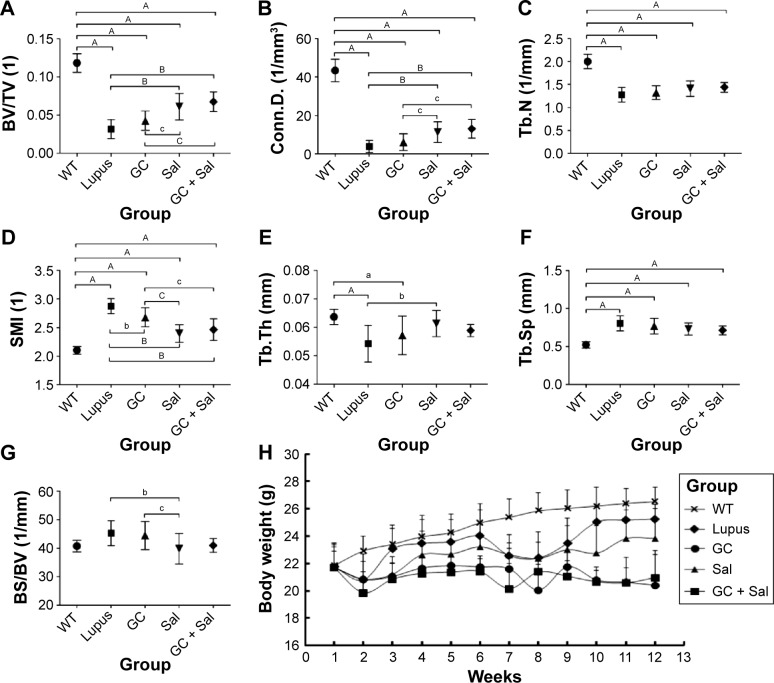
Figure 2.
Micro-CT analysis of proximal tibial metaphysis (PTM) and monitored body weight data of lupus mice undergoing different treatments.
Notes: (A) BV/TV, (B) Conn.D, (C) Tb.N, (D) SMI, (E) Tb.Th, (F) Tb.Sp, (G) BS/BV, (H) Body weight data for lupus mice within different treatment groups. WT group, wild type mice; lupus group, lupus mice (B6.MRL-Faslpr/J); GC group, lupus mice with prednisone treatment; Sal group, lupus mice with salvianolate treatment; GC + Sal group, lupus mice with prednisone plus salvianolate treatment. Values are presented as mean ± SD, aP<0.05 vs WT; AP<0.01 vs WT; bP<0.05 vs lupus; BP<0.01 vs lupus; cP<0.05 vs GC; CP<0.01 vs GC.
Abbreviations: BS/BV, bone surface to bone volume; BV/TV, bone volume to tissue volume; Conn.D, connectivity density; GC, glucocorticoid; micro-CT, micro-computed tomography; Sal, salvianolate; SD, standard deviation; SMI, structure model index; Tb.N, trabecular number; Tb.Sp, trabecular separation; Tb.Th, trabecular thickness.

