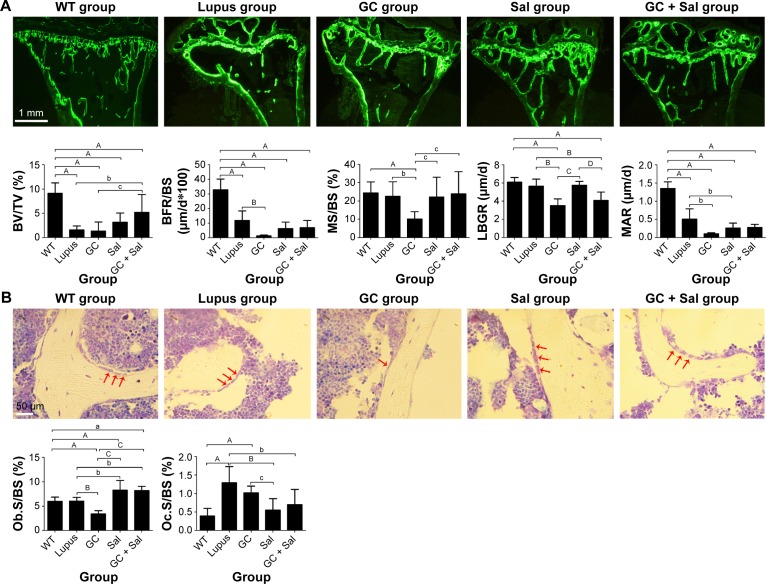
Figure 3.
Representative bone fluorescence micrographs of PTM (calcein fluorescence, magnification: 40×), osteoblast morphology (undecalcified sectioning with toluidine blue staining, magnification: 40×), and bone histomorphometry analysis in lupus mice undergoing different treatments.
Notes: The regions of interest for analyses were located between 1 and 3 mm distal to the growth plate–epiphyseal junction. (A) Representative bone fluorescence micrographs and histomorphometry analysis. (B) Representative toluidine blue staining images of PTM and histomorphometry analysis of osteoblast and osteoclast. WT group, wild-type mice; lupus group, lupus mice (B6.MRL-Faslpr/J); GC group, lupus mice with prednisone treatment; Sal group, lupus mice with salvianolate treatment; GC + Sal group, lupus mice with prednisone plus salvianolate treatment. Values are presented as mean ± SD. aP<0.05 vs WT; AP<0.01 vs WT; bP<0.05 vs lupus; BP<0.01 vs lupus; cP<0.05 vs GC; CP<0.01 vs GC; DP<0.01 vs Sal. Red arrows point to osteoblasts.
Abbreviations: BFR/BS, bone formation rate to bone surface; BV/TV, bone volume to tissue volume; GC, glucocorticoid; LBGR, longitudinal bone growth rate; MAR, mineral apposition rate; MS/BS, the ratio of mineralizing surface to bone surface; Ob.S/BS, osteoblast surface per unit of bone surface; Oc.S/BS, osteoclast surface per unit of bone surface; PTM, proximal tibial metaphysis; Sal, salvianolate; SD, standard deviation.

