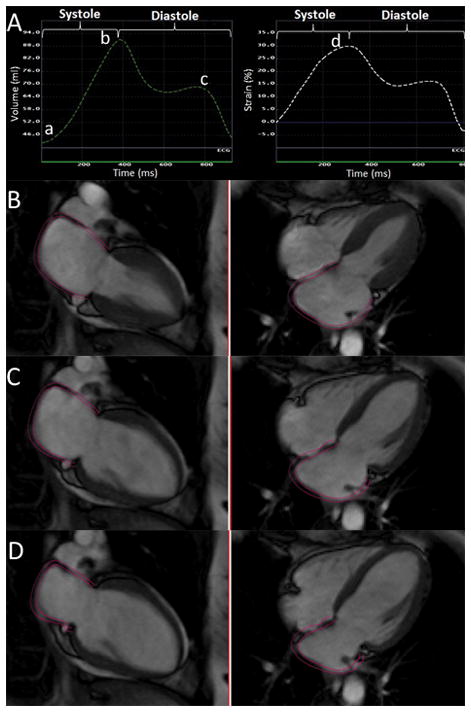
Figure 1.

A: Phasic LA volume (left) and global longitudinal strain (right) curves during ventricular systole and diastole. Points “a”, “b” and ‘c” are representing minimum, and maximum LA volume and LA volume before atrial contraction respectively. On the longitudinal strain curve (left), point “d” represents peak LA longitudinal strain. Feature tracking MRI in different phases of cardiac cycle,: end systole (B), before atrial contraction (C), and end diastole (D).
