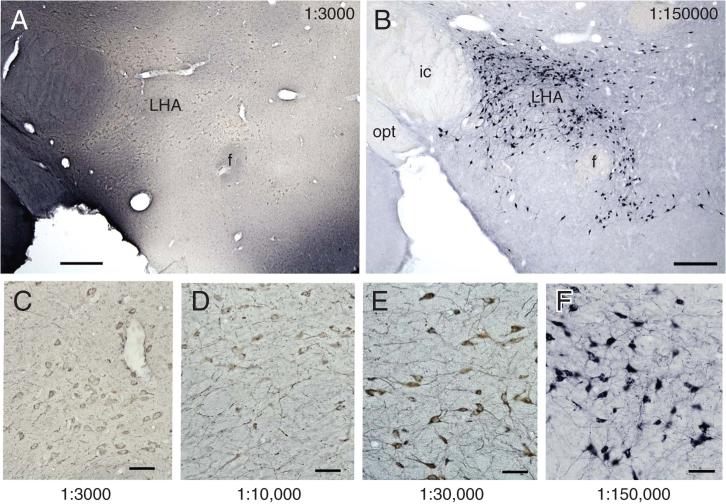
Figure 2.12.5.
Variation in the color of the NiDAB product when high versus low concentrations of the primary antibody are used. Low-power micrographs show melanin-concentrating hormone (MCH) in the lateral hypothalamic area (LHA) using the anti-MCH at 1:3,000 and 1:150,000. Note that at the high concentration of the antibody (A), the staining is uneven and in some regions has very high background compared with that seen when the primary antibody concentration is reduced (B). The series along the bottom (C to F) provides higher magnification and a more complete titration series that illustrates how the signal-to-noise ratio increases and the color shifts from brown to blue-black as the antibody is diluted to its optimum. Scale bar for A and B = 250 μm; C-F = 50 μm. Abbreviations: ic = internal capsule, f = fornix, opt = optic tract. For the color version of this figure go to http://www.currentprotocols.com.

