
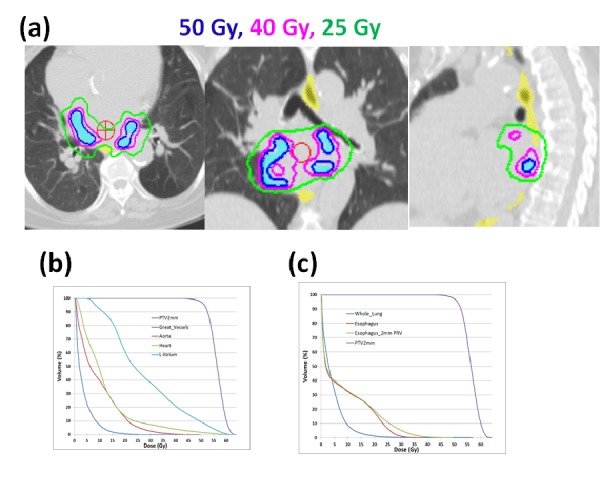
Figure 2. A) Three-dimensional dose distributions for a selected patient and B-C) dose volume histograms.
Official websites use .gov
A
.gov website belongs to an official
government organization in the United States.
Secure .gov websites use HTTPS
A lock (
) or https:// means you've safely
connected to the .gov website. Share sensitive
information only on official, secure websites.