
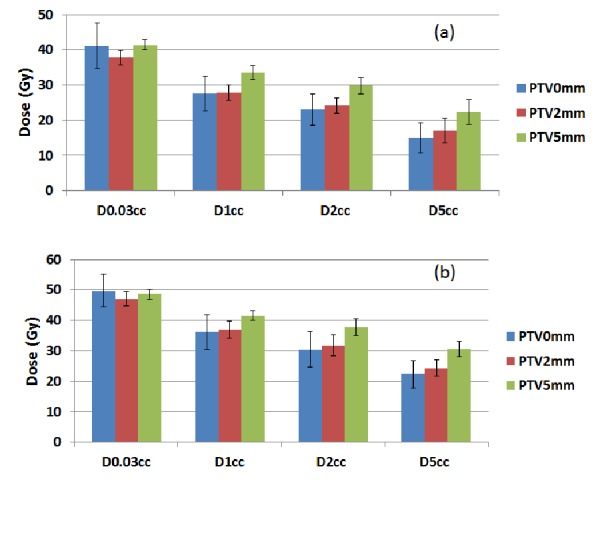
Figure 3. A) The average doses of D0.03 cc, D1 cc, D2 cc, and D5 cc of esophagus and B) esophagus PRV and their standard deviations for PTV-0 mm, PTV-2 mm, and PTV-5 mm plans.
Official websites use .gov
A
.gov website belongs to an official
government organization in the United States.
Secure .gov websites use HTTPS
A lock (
) or https:// means you've safely
connected to the .gov website. Share sensitive
information only on official, secure websites.