
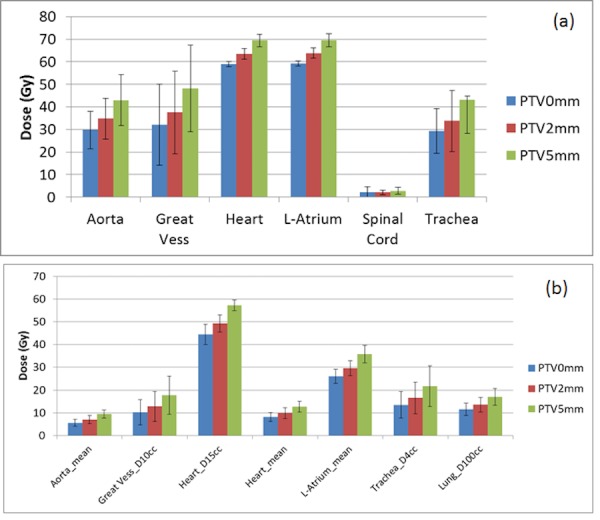
Figure 4. A) The average maximum doses and B) the average volume specified doses to listed organs and their standard deviations.
Official websites use .gov
A
.gov website belongs to an official
government organization in the United States.
Secure .gov websites use HTTPS
A lock (
) or https:// means you've safely
connected to the .gov website. Share sensitive
information only on official, secure websites.