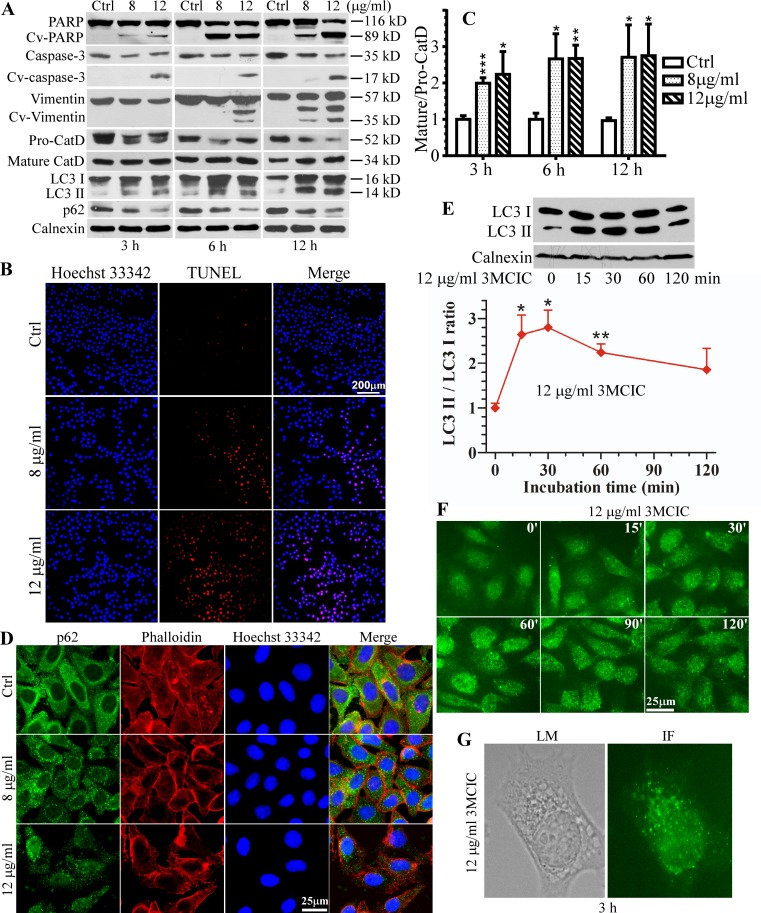
Fig 8. Activation of cell death pathways in 3MCIC-treated HepG2 cells.
(A) Western blots showing 3MCIC-induced PARP, caspase-3 and vimentin cleavages, CatD maturation, LC3 I & II upregulation, and p62 downregulation. (B) The TUNEL assay after 3MCIC treatment for 12 h. (C) Normalized relative band-intensity ratios of mature/pro-CatD in 3MCIC-treated groups over controls were plotted. (D) Immunofluorescence of HepG2 cells treated with 3MCIC for 3 h, and stained with p62 mAb (green), phalloillin (red) and Hoechst 33342. (E) The early-stage alternations of LC3 under 12 μg/ml 3MCIC treatment. Normalized relative band-intensity ratios of LC3 II/LC3 I in 3MCIC-treated groups over controls were plotted. In C & E, *P<0.05, **P<0.01 and ***P<0.001 vs control (n = 3). (F) LC3 immunofluorescence of HepG2 cells treated with 12 μg/ml 3MCIC at the indicated times. (G) A HepG2 cell was observed either by a light microscope (LM) to show the vacuoles, or by immunofluorescence (IF) with a LC3 mAb, after incubation with 12 μg/ml 3MCIC for 3 h.

