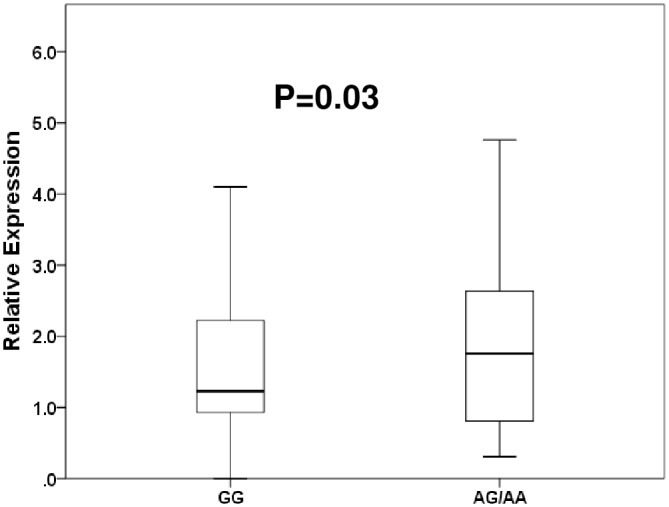
Fig 3. Distribution of relative expression of CYP19A1 messenger RNA using real-time PCR in noncancerous tissues of lung cancer patients divided by the major allele (guanine) versus homozygosity and heterozygosity of the minor allele (adenine) of a rs3764221 in CYP19A1.

Data are represented as box and whisker plots. The median value was represented by a horizontal line in the box pot, and gray box denoted the 75th (upper margin) and 25th percentiles of the values (lower margin), respectively. The upper and lower bars indicated the 90th and 10th percentiles, respectively. The statistical analysis was performed using a Mann-Whitney test.
