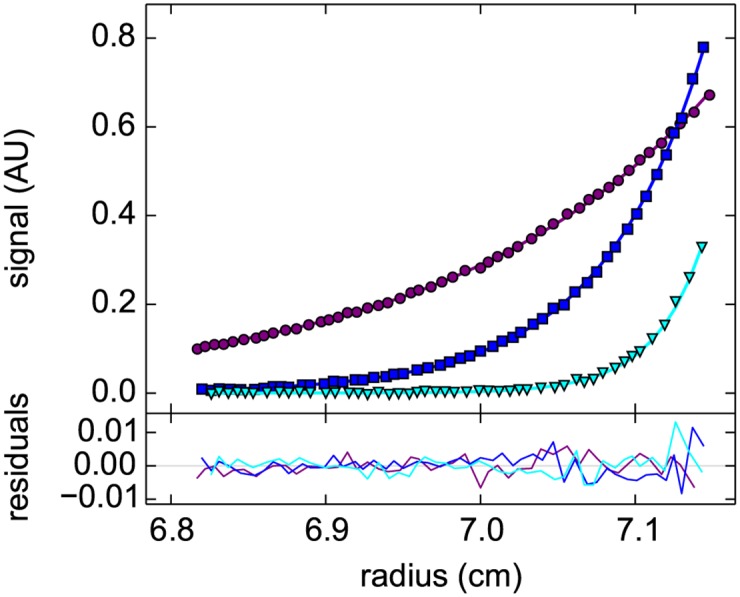
Fig 2. Radial concentration distribution in a sedimentation equilibrium experiment with enhanced green fluorescent protein in a “prime gray” photopolymer centerpiece.

Data were acquired with the absorbance detection sequentially at rotor speeds of 15,000 rpm (purple), 24,000 rpm (blue), and 35,000 rpm (cyan) (symbols, only every 5th data point shown). A global model (lines) results in an apparent molar mass of 29.7 kDa with a root-mean-square deviation (rmsd) of 0.0032 OD489, and residuals as shown in the lower plot.
